GBP/USD 5M

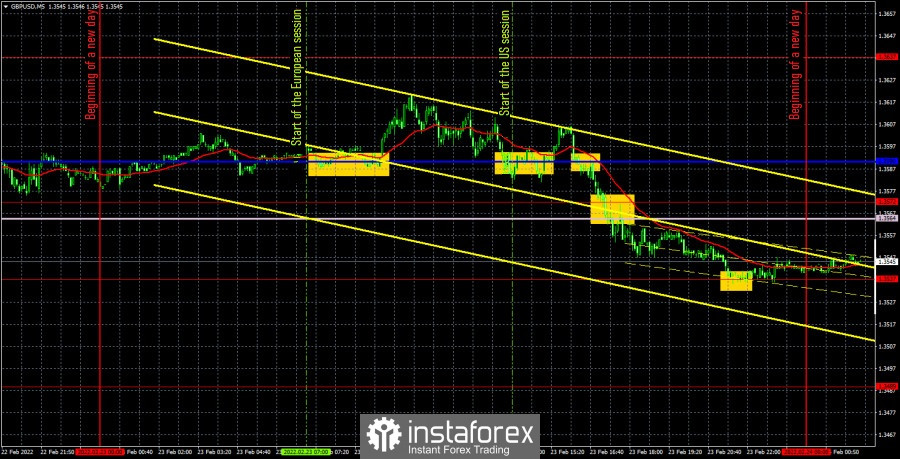
The GBP/USD currency pair continued to ride a roller coaster on Wednesday, but in the afternoon it still showed a more or less trending movement. The movement at the European trading session was as vague as possible. In general, the pound also continues to trade flat, which is perfectly visible on the higher timeframes. At this time, it has approached the important level of 1.3537, from which a rebound may follow with a new round of upward movement. There were no macroeconomic publications yesterday in either the US or the UK, but parliamentary hearings on the Bank of England report were held in Britain, as well as a speech by Chairman Andrew Bailey. It should be noted that Bailey did not tell the market anything super-important. And in any case, the pound began to fall in the afternoon, and the speeches of Bailey and his colleagues took place in the morning. Thus, yesterday's fundamental background was not related to the technical picture.
As for trading signals, they were again not the best. The first buy signal was formed early in the morning, after which the price went up exactly 20 points. Traders at least managed to set the Stop Loss to breakeven, after which the price immediately returned to the critical line. It bounced off it again (again it was possible to buy the pair), but this time it did not go up 20 points, and later it settled below Kijun-sen, which should have been regarded as a sell signal. This signal was already strong enough, but the point is not in it, but in the fact that a trend movement began at that time, which allowed traders to earn money in the end. The price dropped to the Senkou Span B line, overcame it and reached 1.3537 by the end of the day. Therefore, it was possible to earn 40 points on the sale transaction, which covered the losses on the second transaction.
COT report

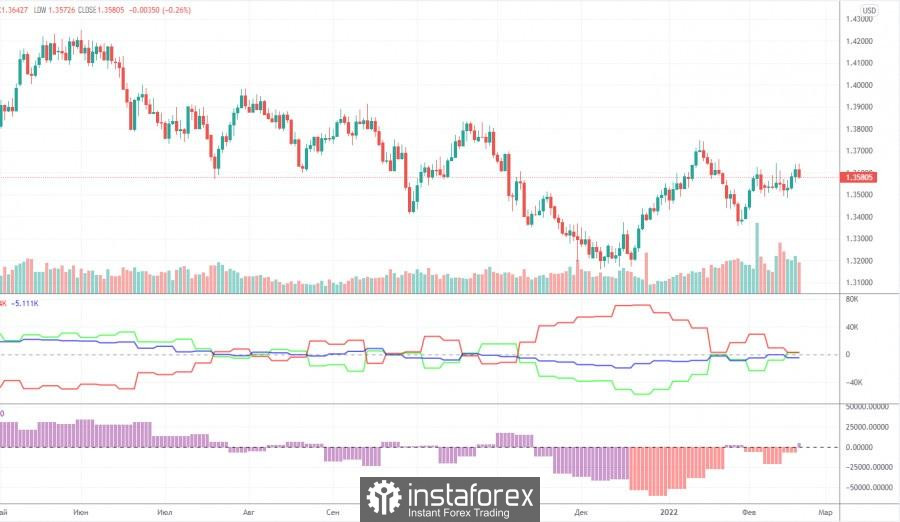
The latest Commitment of Traders (COT) report on the British pound showed an increase in bullish sentiment among professional traders. For the first time in several months, the number of long positions from the non-commercial group exceeded the number of short positions, so we can assume that the annual downward trend is over. In principle, the situation with COT reports on the pound is very similar to the situation on the euro. There, too, major players are increasing long positions, but at the same time the euro continues to be very close to its annual lows and in fact is not growing. But the pound, as we have repeatedly said, shows a smaller drop against the dollar and is growing more confidently. At the moment, it is at a much greater distance from its annual lows, so we believe that if there is a new fall, the pound will fall less than the euro. If there is a new growth, the pound will grow stronger than the euro. This is now explained by the fact that against the background of the planned multiple increases in the Federal Reserve's key rate in 2022, the European Central Bank simply refuses to raise its rate, and the Bank of England has already raised it twice. Thus, due to this discrepancy in the rates for tightening monetary policy, the pound occupies a more advantageous position in comparison with the euro currency. Moreover, non-commercial traders have just recently been bearish about the pound, which is eloquently shown by the green line of the first indicator or the second indicator in the chart above. However, it is over the past couple of months that their mood has become much more bullish.
We recommend to familiarize yourself with:
Overview of the EUR/USD pair. February 24. The foreign exchange market is still not interested in geopolitics.
Overview of the GBP/USD pair. February 24. Bank of England: inflation, inflation and only inflation.
Forecast and trading signals for EUR/USD on February 24. Detailed analysis of the movement of the pair and trading transactions.
GBP/USD 1H

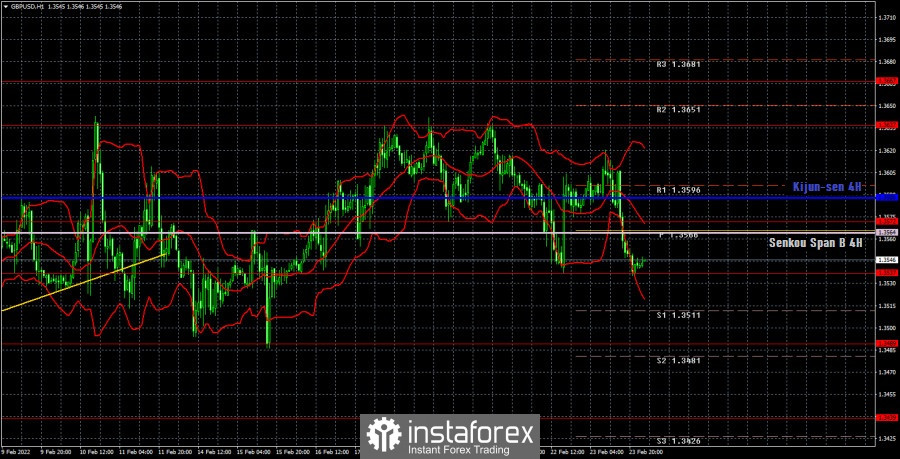
The technical picture on the hourly timeframe has not changed over the past day. It's still the same "swing", it's still the same horizontal channel. Since February 1, the price has been between the levels of 1.3489 and 1.3637, that is, in a channel 150 points wide. And nothing is changing at the moment. Moreover, even if the fall continues today, the pair will still remain inside the horizontal channel. There is no trend now. We highlight the following important levels on February 24: 1.3439, 1.3489, 1.3537, 1.3572, 1.3637, 1.3667. The Senkou Span B (1.3564) and Kijun-sen (1.3588) lines can also be signal sources. Signals can be "bounces" and "breakthroughs" of these levels and lines. It is recommended to set the Stop Loss level to breakeven when the price passes in the right direction by 20 points. The lines of the Ichimoku indicator can move during the day, which should be taken into account when determining trading signals. There are also support and resistance levels on the chart that can be used to take profits on transactions. Bailey is set to speak in the UK on Thursday, but most likely its result will be the same as yesterday. A GDP report will also be released in the US today, but this will be its second estimate, so the value is unlikely to differ much from the previous estimate.
Explanations for the chart:
Support and Resistance Levels are the levels that serve as targets when buying or selling the pair. You can place Take Profit near these levels.
Kijun-sen and Senkou Span B lines are lines of the Ichimoku indicator transferred to the hourly timeframe from the 4-hour one.
Support and resistance areas are areas from which the price has repeatedly rebounded off.
Yellow lines are trend lines, trend channels and any other technical patterns.
Indicator 1 on the COT charts is the size of the net position of each category of traders.
Indicator 2 on the COT charts is the size of the net position for the non-commercial group.
 English
 Русский
 Bahasa Indonesia
 Bahasa Malay
 ไทย
ไทย Español
 Deutsch
 Български
 Français
 Tiếng Việt
 中文
中文 বাংলা
বাংলা हिन्दी
 Čeština
 Українська
 Română

