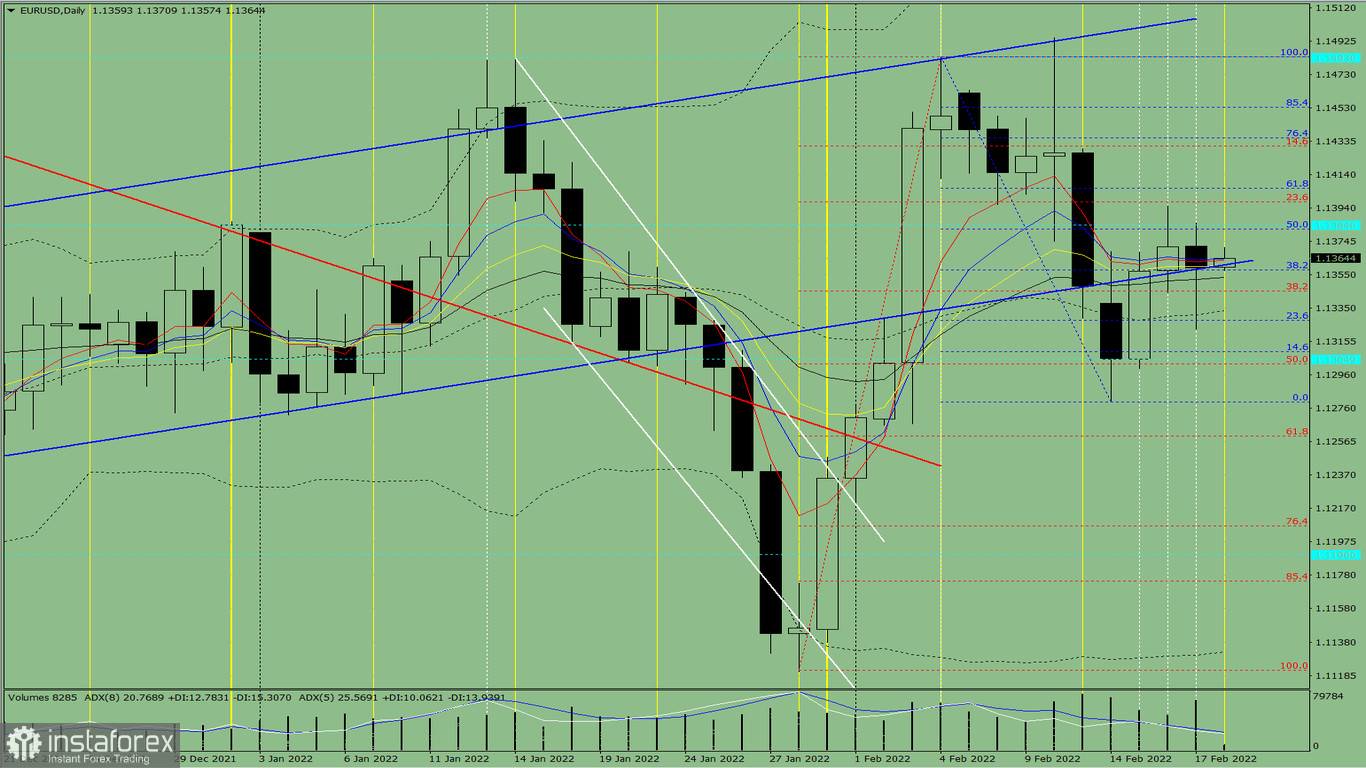
On Thursday, the euro/dollar pair declined due to economic reports, trying to break through1.1352, the simple 21 average (black dotted line). After that, the price went up, having already tested the historical resistance level of 1.1384 (blue dotted line). It closed the daily candlestick at 1.1359. Today, the pair may continue to move up. There will be important economic reports at 13:00 MSK (EUR) and 18:00 MSK (USD).
Trend analysis (fig.1)
Today, the price is likely to rise from the level of 1.1359 (the closing of yesterday's daily candlestick) and reach the Fibonacci retracement level of 50.0%, 1.1382 (blue dotted line). After testing this level, it may hit the target level of 1.1406, the retracement level of 61.8% (blue dotted line).

Fig. 1 (daily chart).
Complex analysis:
-indicator analysis – up;
-Fibonacci retracement levels– up;
- trading volumes - up;
- candlestick analysis - up;
- trend analysis - up;
- Bollinger lines - up;
- weekly chart - up.
Conclusion:
Today, the price is likely to rise from the level of 1.1359 (the closing of yesterday's daily candlestick) and reach the Fibonacci retracement level of 50.0%, 1.1382 (blue dotted line). After testing this level, it may hit the target level of 1.1406, the retracement level of 61.8% (blue dotted line).
Alternatively, the pair may drop from the level of 1.1359 (closing of yesterday's daily candlestick) and try to break through the lower border of 1.1323 (daily candlestick from February 17, 2022). After testing this level, it is likely to rise to 1.1382, a 50% pullback level (blue dotted line).
 English
 Русский
 Bahasa Indonesia
 Bahasa Malay
 ไทย
ไทย Español
 Deutsch
 Български
 Français
 Tiếng Việt
 中文
中文 বাংলা
বাংলা हिन्दी
 Čeština
 Українська
 Română

