EUR/USD 5M

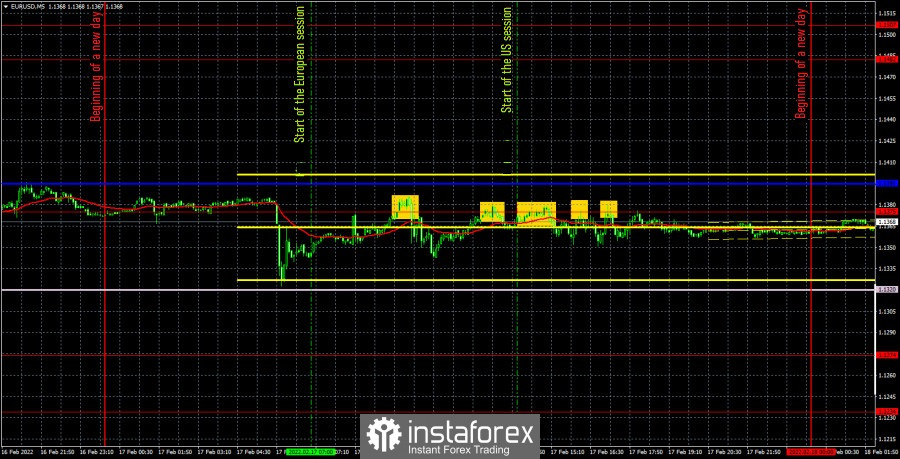
The EUR/USD pair continued to trade indistinctly on Thursday. In principle, the chart above clearly shows what we mean. We are talking about the fact that the quotes spent most of the day near the level of 1.1375, which, in fact, means an intraday flat. However, at the same time, during the Asian trading session, the pair managed to fall by 50 points in just 15 minutes. It is unclear as to what provoked such a movement, although perhaps it's all about geopolitics, which has recently come to the fore in front of the whole world. Yesterday, there were no important publications or events in either the United States or the European Union. All day long, messages about the Ukrainian-Russian conflict have been coming from various sources. In particular, US President Joe Biden said that an invasion of Ukraine could happen in the coming days. Moscow also sent an official response to Washington, which focuses on the fact that the United States refuses to take Russia's interests into account, so "a military response may follow." Moscow did not specify what it actually meant, as it also declared that it is not going to invade Ukraine. In general, everything is complicated.
As for trading signals, they were all formed around the level of 1.1375. The first sell signal was terribly inaccurate. Nevertheless, after its formation, the price went down about 25 points, so traders could at least put a Stop Loss on the short position at breakeven, and at most even get a small profit. Although it was very difficult to do this, since no one knew when the decline would end, and the pair could not get to the nearest target. All subsequent signals were the same - bounces from the level of 1.1375. Each subsequent signal spoke only in favor of the fact that the flat remains and it is not necessary to trade now. Although formally, even if traders opened a short position on these signals, they did not receive a loss, since the price could not settle above 1.1375.
COT report

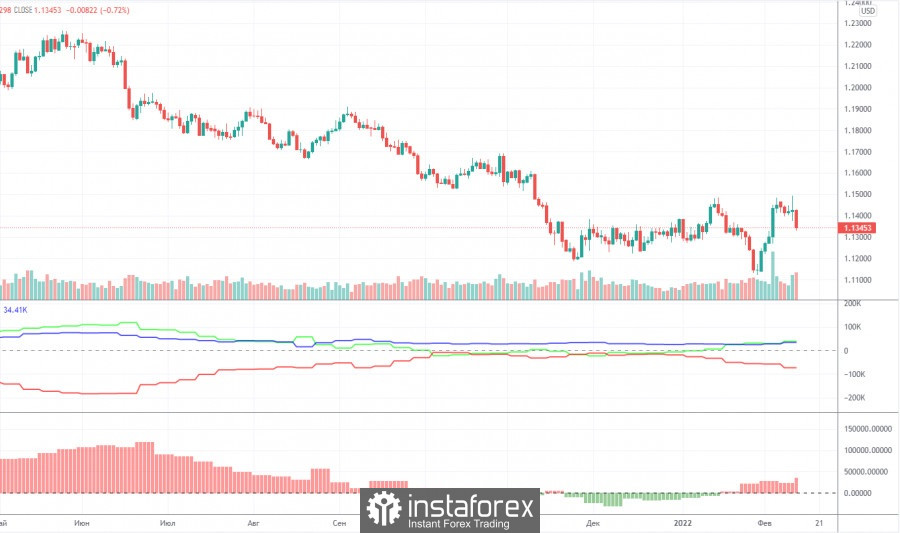
The new Commitment of Traders (COT) report, which was released on Friday, did not show any major changes, and its data does not reflect what is happening in the foreign exchange market at all. In short, professional players continued to increase long positions during the reporting week, as well as get rid of short positions. In total, the net position of the non-commercial group increased by 11,000. So now we have a picture in which major players have been buying the euro currency for several consecutive weeks, and their mood is clearly bullish. The new COT report shows the behavior of traders a week earlier (it comes out with a 3-day delay). And last week, the euro was growing steadily. However, look at the chart above: is the current technical picture similar to the beginning of an upward trend? After all, even last week the price updated its annual lows! Thus, formally, it can be concluded that the major players are already looking towards long positions on the euro currency, but in practice this mood is so unstable that at any moment it can result in a new fall of the euro/dollar pair. The main factor that should be taken into account now is the lack of growth factors in the euro. And if we add to this the tense geopolitical situation that developed at the beginning of the new year, then it is the dollar that has additional growth factors. And there were plenty of them even without geopolitics. Thus, as before, there is a high probability of dollar growth.
We recommend to familiarize yourself with:
Overview of the EUR/USD pair. February 18. False alarm. At least, that's what the markets thought.
Overview of the GBP/USD pair. February 18. The FOMC minutes turned out to be a "dummy".
Forecast and trading signals for GBP/USD on February 18. Detailed analysis of the movement of the pair and trading transactions.
EUR/USD 1H

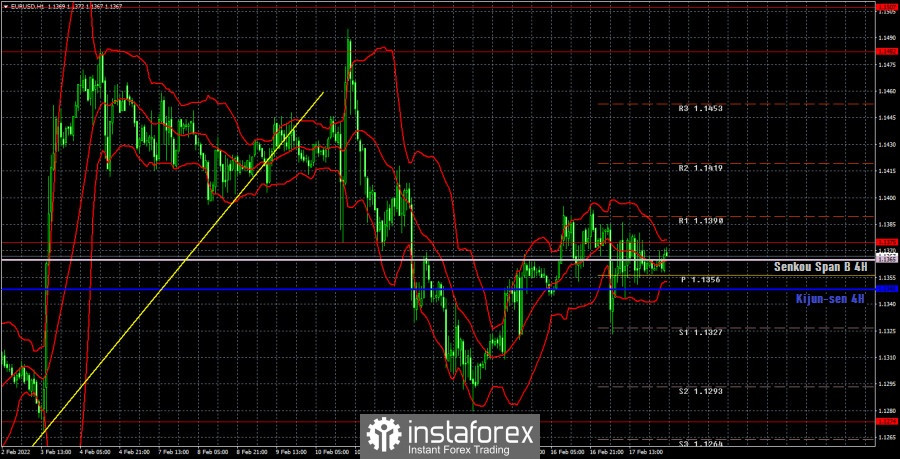
The indistinctness of the current movements is even more visible on the hourly timeframe. An important signal is that the lines of the Ichimoku indicator have become very close, which also indicates a flat at this time. It also suggests that the lines themselves are not strong now and can be ignored by traders. The technical picture is very unfavorable now. As well as the fundamental background, which simply does not exist. As well as the geopolitical background, which makes the markets nervous and cautious. We allocate the following levels for trading on Friday – 1.1192, 1.1234, 1.1274, 1.1375, 1.1482, 1.1507, as well as the Senkou Span B (1.365) and Kijun-sen (1.1348) lines. There are also support and resistance levels, but no signals will be formed near them. The lines of the Ichimoku indicator may change their position during the day, which should be taken into account when searching for trading signals. Signals can be "bounces" and "breakthrough" levels - extremes and lines. Do not forget about placing a Stop Loss order at breakeven if the price went in the right direction of 15 points. This will protect you against possible losses if the signal turns out to be false. No important events and reports planned either in the European Union or in the United States on Friday. Therefore, you will have to pay attention only to geopolitical news, and the probability of flat and indistinct movement will remain high.
Explanations for the chart:
Support and Resistance Levels are the levels that serve as targets when buying or selling the pair. You can place Take Profit near these levels.
Kijun-sen and Senkou Span B lines are lines of the Ichimoku indicator transferred to the hourly timeframe from the 4-hour one.
Support and resistance areas are areas from which the price has repeatedly rebounded off.
Yellow lines are trend lines, trend channels and any other technical patterns.
Indicator 1 on the COT charts is the size of the net position of each category of traders.
Indicator 2 on the COT charts is the size of the net position for the non-commercial group.
 English
 Русский
 Bahasa Indonesia
 Bahasa Malay
 ไทย
ไทย Español
 Deutsch
 Български
 Français
 Tiếng Việt
 中文
中文 বাংলা
বাংলা हिन्दी
 Čeština
 Українська
 Română

