Technical Market Outlook:
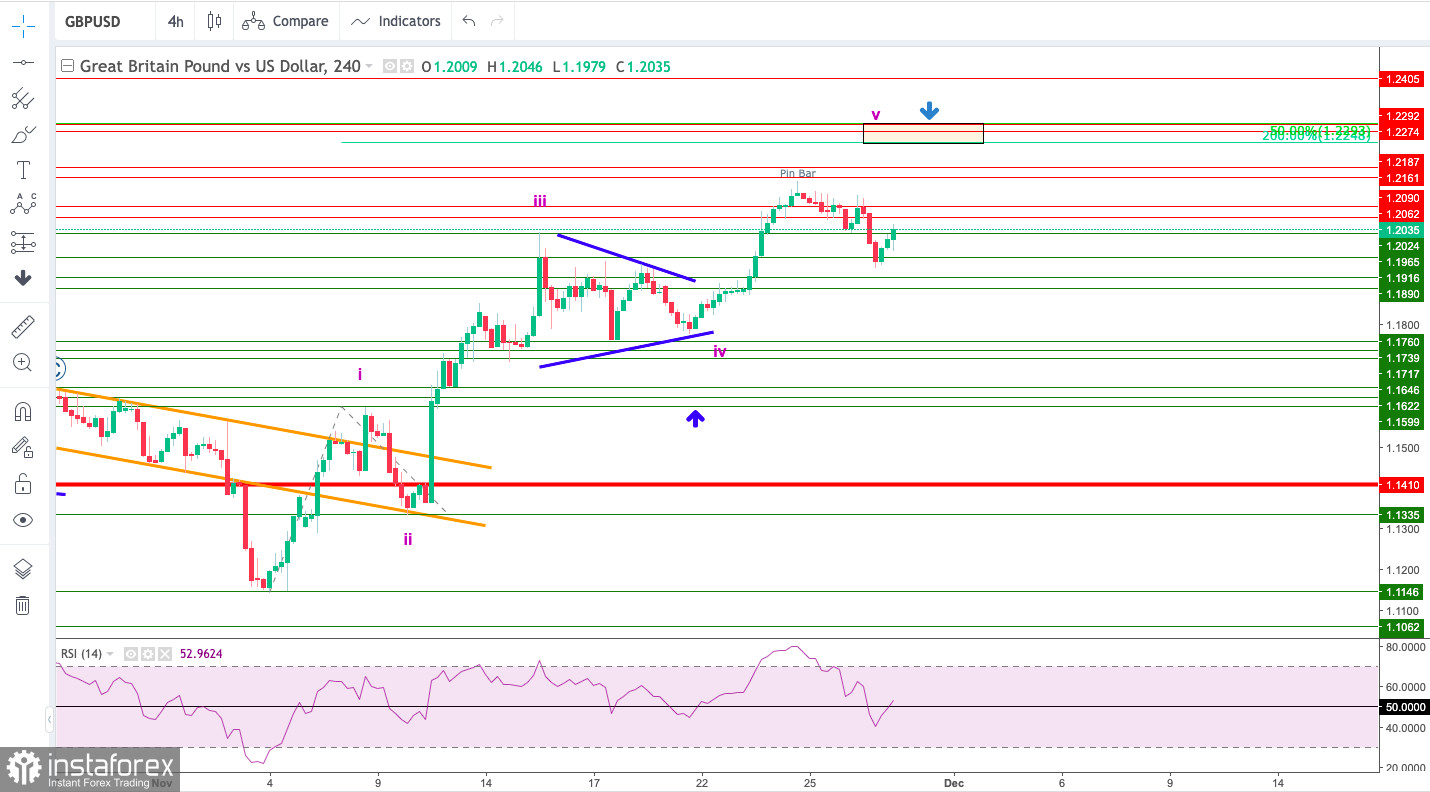
The GBP/USD pair has made another higher high at the H4 time frame chart located at 1.2154. Currently, the market is making the wave v of the overall cycle and the target for this wave is located at 1.2248, so there is less than 100 pips away. The 50% Fibonacci retracement of the whole big wave down is seen at 1.2293, so the up move might extend towards this level as well. The key intraday technical support was seen at 1.2024 and this level was violated already as the pull-back from highs extends towards the technical support seen at 1.2000 and 1.1916.

Weekly Pivot Points:
WR3 - 1.21733
WR2 - 1.21168
WR1 - 1.20955
Weekly Pivot - 1.20603
WS1 - 1.20390
WS2 - 1.20038
WS3 - 1.19473
Trading Outlook:
The bulls are temporary in control of the market and the 50% Fibonacci retracement of the last big wave down located at 1.2293 might be tested soon. On the other hand, the level of 1.0351 has not been tested since 1985, so the down trend is strong. In order to terminate the down trend, bulls need to close the weekly candle above the level of 1.2275 (swing high from August 10th).
 English
 Русский
 Bahasa Indonesia
 Bahasa Malay
 ไทย
ไทย Español
 Deutsch
 Български
 Français
 Tiếng Việt
 中文
中文 বাংলা
বাংলা हिन्दी
 Čeština
 Українська
 Română

