Analysis of Tuesday's trades:
GBP/USD 30M Chart

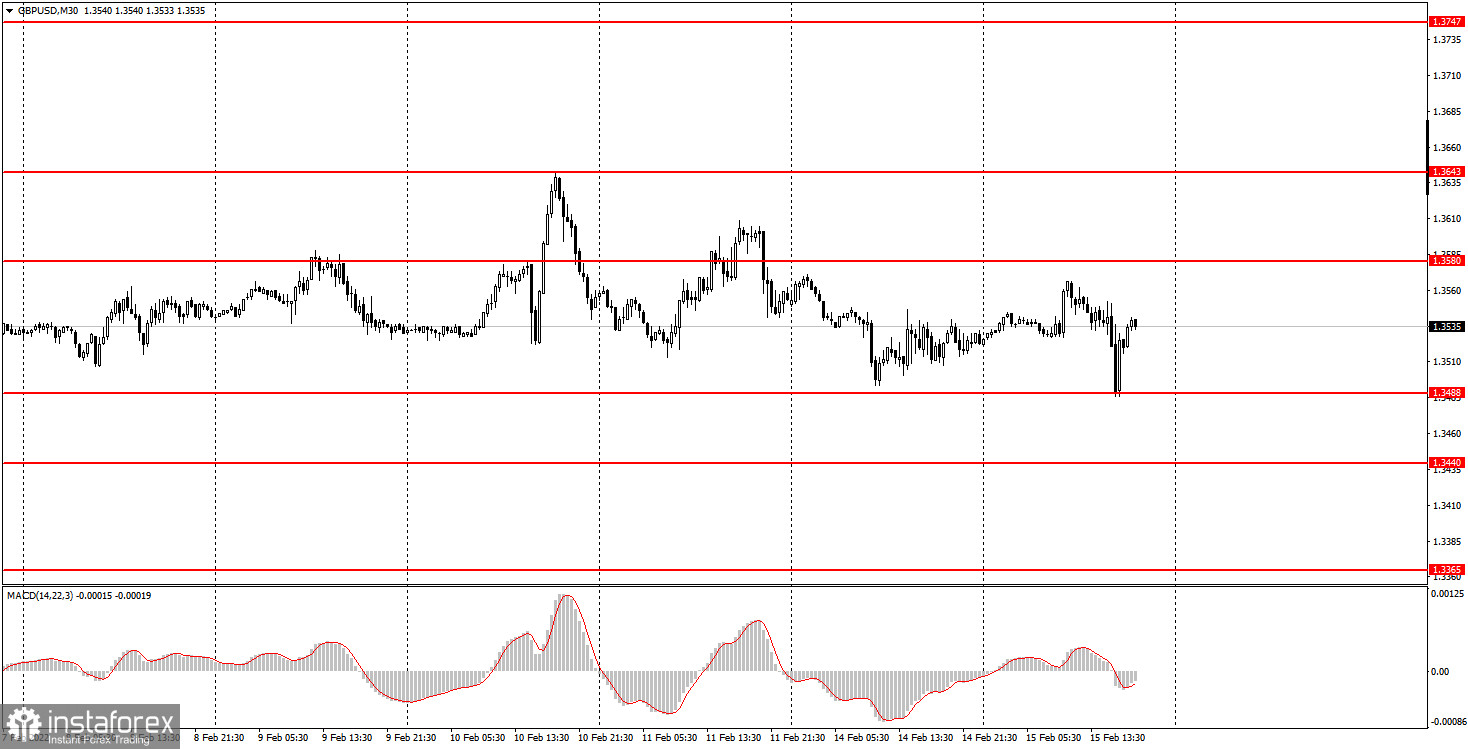
On Tuesday, February 15th, the GBP/USD was still trading in a choppy mode. As mentioned in my previous analysis, the cable is neither in a flat trend nor in any directional movement which is clearly seen in the chart above. So, we cannot make any reasonable conclusion about which direction the price will take in the near future. There is neither a trend line nor a price channel. A fundamental background has a weak impact on investor sentiment. Overall, the situation is rather mixed and complicated due to geopolitical tensions over Ukraine. It is impossible to foresee the market reaction to escalation, if any, given that nobody knows what will happen and when. Today, the United Kingdom released upbeat unemployment data and wages stats, but surprisingly, the pound sterling was not boosted by the news. On the contrary, the British currency continued printing zig-zag movements. A plunge to 1.3488 triggered a new round of upward movement, but it cannot be classified as any definite tendency.
GBP/USD 5M Chart

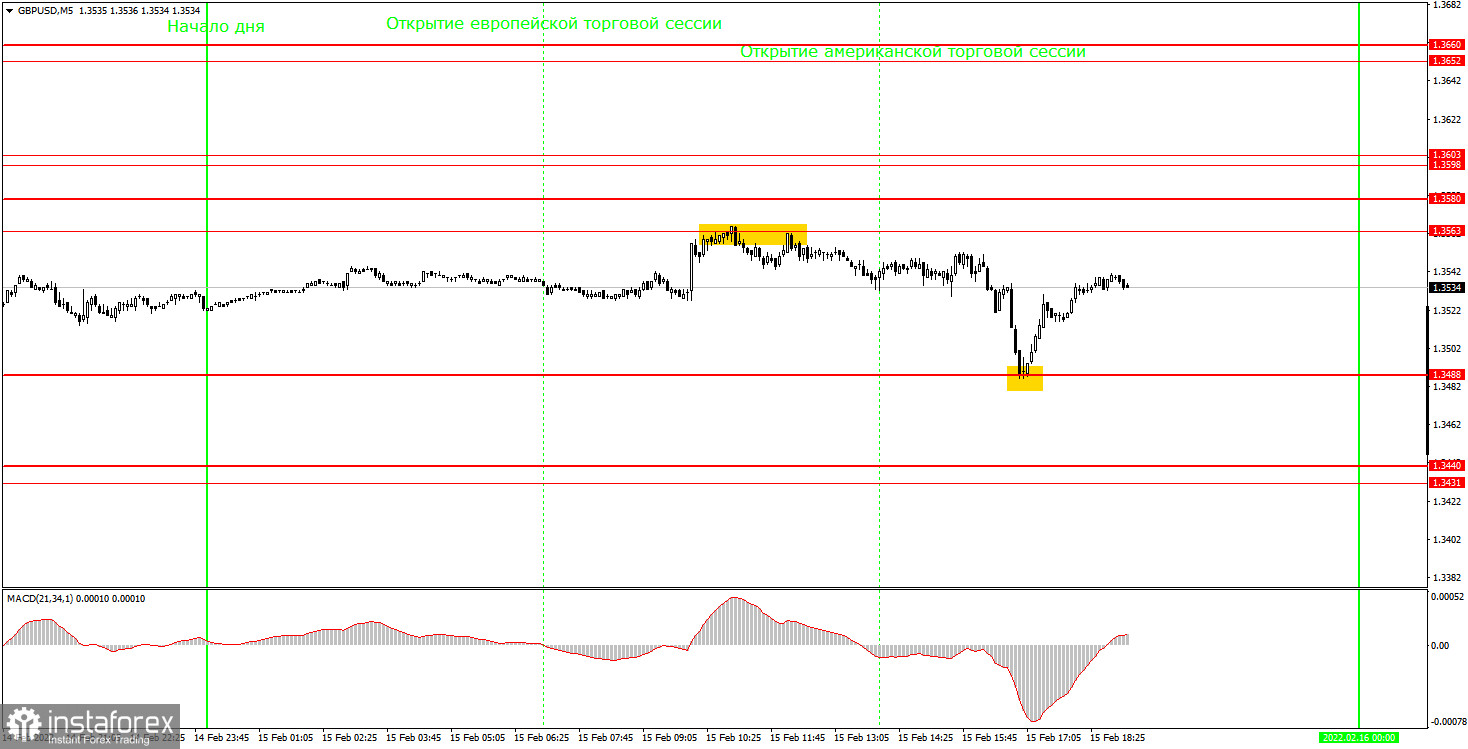
In the 5M time frame, the technical picture looks awful. The pair's movements are choppy and hard-to-predict. The price changes directions all the time, and the market reaction to fundamental and macroeconomic events is puzzling. It was a lucky day for beginning traders. During the day, the pair was fluctuating between 1.3488 and 1.3563 and reached both these levels. Thus, we received two trading signals on Tuesday which turned out to be surprisingly accurate. It has rarely happened in recent days. The first sell signal was formed when the price rebounded from the level of 1.3563. It provided great selling opportunities. The short positions should have been closed when the price reached the level of 1.3488 and rebounded from it. It was reasonable to open long positions shortly after that, which also brought profit to traders. During the downward movement, the pair went down about 60 pips, so 50 pips of profit could be made on a short position. From the level of 1.3488, the price went about 30 points, so trades had to be closed manually. So, a seemingly difficult day for traders has brought decent profits and two strong trading signals.
Trading plan for Wednesday, February 16:
In the 30M time frame, the upward trend became invalid, but the downward one has not been formed. The pair has been stuck between 1.3488 and 1.3643 for seven days in a row. We cannot say for sure that the trend is flat, but there is no definite trend now either. Therefore, the current situation for the pound sterling is rather confusing and ambiguous. On the 5M time frame, the target levels can be found at 1.3431-1.3440, 1.3488, 1.3563-1.3580, 1.3598-1.3603, 1.3652-1.3660. Set a Stop loss at a breakeven point if the rate goes 20 pips in your direction after opening a trade. Tomorrow, the UK will publish the inflation report for January which is likely to attract close attention. The market reaction may follow. In the US, a rather important report on retail sales will see the light. Besides, we should remember that there may be new updates on geopolitics, which can also seriously affect the market sentiment.
The basic principles of the trading system:
1) The strength of the signal depends on the time period during which the signal was formed (a rebound or a break)/ The shorter this period, the stronger the signal.
2) If two or more trades were opened at some level following false signals, i.e. those signals that did not lead the price to Take Profit level or the nearest target levels, then any consequent signals near this level should be ignored.
3) During the flat trend, any currency pair may form a lot of false signals or do not produce any signals at all. In any case, the flat trend is not the best condition for trading.
4) Trades are opened in the time period between the beginning of the European session and until the middle of the American one when all deals should be closed manually.
5) We can pay attention to the MACD signals in the 30M time frame only if there is good volatility and a definite trend confirmed by a trend line or a trend channel.
6) If two key levels are too close to each other (about 5-15 pips), then this is a support or resistance area.
What's on the chart:
Support and Resistance price levels can serve as targets when buying or selling. You can place Take Profit levels near them.
Red lines are channels or trend lines that display the current trend and show which direction is better to trade.
MACD indicator (14,22,3) is a histogram and a signal line showing when it is better to enter the market when they cross. This indicator is better to be used in combination with trend channels or trend lines.
Important speeches and reports that are always reflected in the economic calendars can greatly influence the movement of a currency pair. Therefore, during such events, it is recommended to trade as carefully as possible or exit the market in order to avoid a sharp price reversal against the previous movement.
Beginning traders should remember that every trade cannot be profitable. The development of a reliable strategy and money management are the key to success in trading over a long period of time.
 English
 Русский
 Bahasa Indonesia
 Bahasa Malay
 ไทย
ไทย Español
 Deutsch
 Български
 Français
 Tiếng Việt
 中文
中文 বাংলা
বাংলা हिन्दी
 Čeština
 Українська
 Română

