To open long positions on GBP/USD, you need:
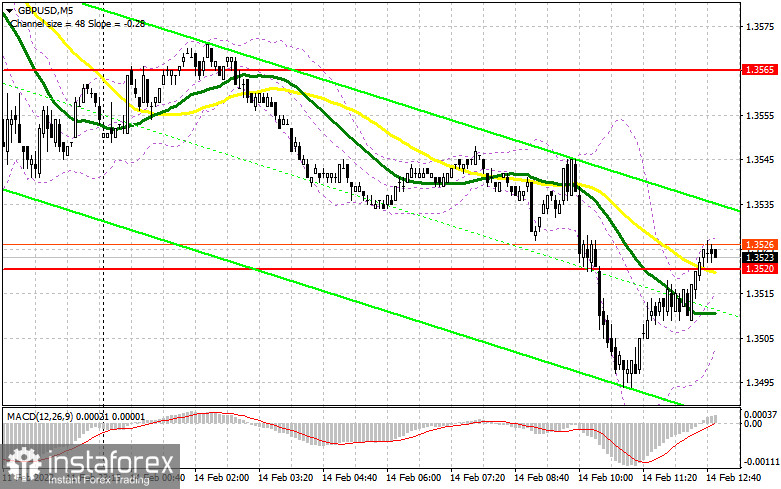
In my morning forecast, I paid attention to the 1.3520 level and recommended making decisions on entering the market from it. Let's look at the 5-minute chart and figure out what happened. The absence of important fundamental statistics led to another sell-off of the British pound, which resulted from the circumstances - an extraordinary meeting of the Federal Reserve System supports buyers of the US dollar and scares traders with risky assets. However, the breakdown of the 1.3520 support took place without a reverse test from the bottom up, so I missed the entry point into short positions. We also did not reach the next support. In the afternoon, the technical picture has completely changed. And what were the entry points for the euro this morning?

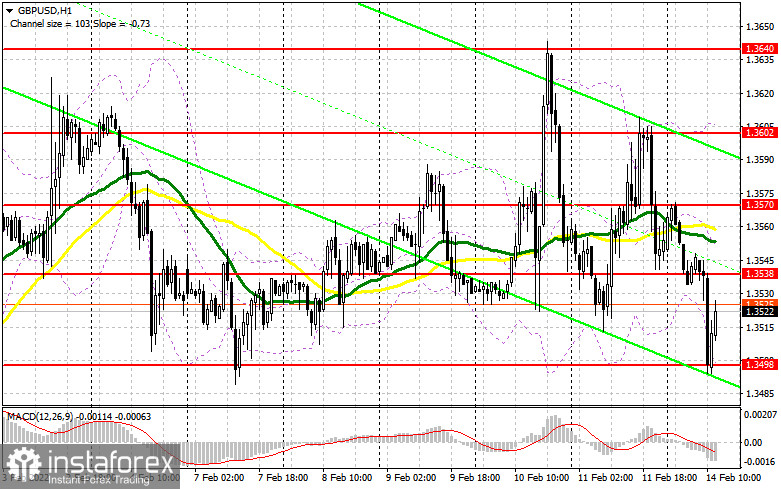
As I have already said, a closed meeting of the Board of Governors of the Federal Reserve System is expected today. It will be conducted following accelerated procedures. At the meeting, it is planned to consider the issue of changing monetary policy, in other words, interest rates are likely to be raised. Given that the meeting is extraordinary, at least the rates will increase by 0.5%. In the event of a tougher policy change, we can count on a further fall in the British pound in the short term. Given that there is hardly anyone willing to buy in the current conditions, it is best not to rush into long positions. The key task of the bulls in the second half of the day will be not only to protect the support of 1.3498 formed in the first half of the day but also to return to control the new resistance of 1.3538, which in the current realities will be very problematic. Just above this level, there are moving averages playing on the sellers' side, which will also limit the upward potential of the pair. Purchases from 1.3498 can be made only if a false breakdown is formed. This forms an entry point into the long, and a breakout and a test of the 1.3538 range from top to bottom form an additional buy signal with a rise to 1.3570 - today's maximum. I recommend fixing profits there. The 1.3602 area will be a more distant target, but we are unlikely to reach it today. In the scenario of a decline in GBP/USD during the US session and the absence of bulls at 1.3498, it is better not to rush into buying risky assets. I advise you to wait for the test of the next major level - 1.3459. Only the formation of a false breakdown there will give an entry point to long positions against the bear market. You can buy the pound immediately on a rebound from 1.3425, or even lower - from a minimum of 1.3394, counting on a correction of 20-25 points within a day.
To open short positions on GBP/USD, you need:
The bears have successfully failed the pair to the lower border of the February side channel and are not going to stop there. Significant changes in the Fed's policy will lead to a more powerful downward movement of the pair. The primary task of sellers is to protect the 1.3538 range since it was completely undesirable to issue a pound above this range. Above this level, we will see a new large wave of growth on stop orders. The formation of a false breakout at 1.3538 together with the Fed statements form an excellent entry point into short positions. You can count on the return of the bear market and the pair's decline to the support area of 1.3498. A breakdown and a test of this range from the bottom up will give an additional entry point into short positions to fall to 1.3459 and 1.3425. A more distant target will be the 1.3394 area, where I recommend fixing the profits. If the pair grows during the American session, as well as weak sellers' activity at 1.3538, it is best to postpone sales to the level of 1.3570. I also advise you to open short positions there in case of a false breakdown. It is possible to sell GBP/USD immediately for a rebound from 1.3602, or even higher - from a maximum in the area of 1.3640, counting on the pair's rebound down by 20-25 points within a day.

The COT reports (Commitment of Traders) for February 1 recorded a sharp increase in short positions and a reduction in long ones. All this led to an increase in the negative value of the delta. However, it should be understood that the report does not take into account the results of the meeting of the Bank of England, at which it was decided to raise interest rates. Despite this, it did not help the pound much, since everyone understands that such policy changes were made not from a good life, but in the fight against high inflation. Given that the British economy is currently going through hard times and at any moment the pace of economic growth may seriously slow down - the rate hike did not lead to a rapid increase in the British pound. We should not forget about the increase in interest rates by the Federal Reserve System in March this year, which will be an additional deterrent for buyers of GBP/USD. Some traders expect that the Central Bank may resort to more aggressive actions and raise rates by 0.5% at once, rather than by 0.25% - this will become a kind of bullish signal for the US dollar. The COT report for February 1 indicated that long non-commercial positions decreased from the level of 36,666 to the level of 29,597, while short non-commercial positions increased from the level of 44,429 to the level of 53,202. This led to an even greater increase in the negative non-commercial net position - from -7,763 to -23,605. The weekly closing price dropped from 1.3488 to 1.3444.
Signals of indicators:
Moving averages
Trading is conducted below 30 and 50 daily moving averages, which indicates market control on the part of sellers.
Note. The period and prices of moving averages are considered by the author on the hourly chart H1 and differ from the general definition of the classic daily moving averages on the daily chart D1.
Bollinger Bands
In the case of a decline, the lower limit of the indicator around 1.3498 will act as support. In the case of growth, the average border of the indicator around 1.3545 will act as resistance.
Description of indicators
- Moving average (moving average determines the current trend by smoothing out volatility and noise). Period 50. The graph is marked in yellow.
- Moving average (moving average determines the current trend by smoothing out volatility and noise). Period 30. The graph is marked in green.
- MACD indicator (Moving Average Convergence / Divergence - moving average convergence/divergence) Fast EMA period 12. Slow EMA period 26. SMA period 9
- Bollinger Bands (Bollinger Bands). Period 20
- Non-profit speculative traders, such as individual traders, hedge funds, and large institutions that use the futures market for speculative purposes and meet certain requirements.
- Long non-commercial positions represent the total long open position of non-commercial traders.
- Short non-commercial positions represent the total short open position of non-commercial traders.
- Total non-commercial net position is the difference between the short and long positions of non-commercial traders.
 English
 Русский
 Bahasa Indonesia
 Bahasa Malay
 ไทย
ไทย Español
 Deutsch
 Български
 Français
 Tiếng Việt
 中文
中文 বাংলা
বাংলা हिन्दी
 Čeština
 Українська
 Română

