What is needed to open long positions on EUR/USD
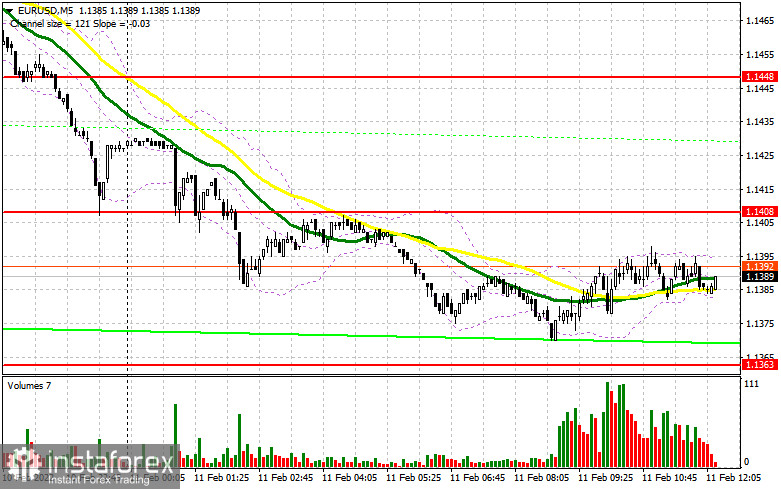
In the morning article, I highlighted several levels as I expected expectation sharp volatility yesterday. However, traders ignored the eurozone economic report. As a result, the price failed the reach the indicated levels. There were no entries into the market. Bulls actively defended yesterday's lows in the area of 1.1373. This was the reason for a slight revision of the technical indicators in the afternoon.

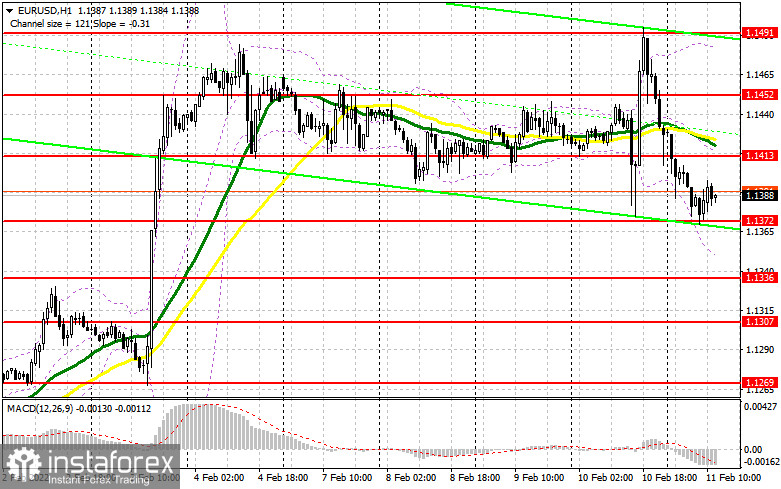
In the US session, the University of Michigan Consumer Sentiment Index survey is due. If the reading rises, the US dollar may exhibit strength against the euro as it did yesterday. Traders are likely to overlook the University of Michigan Inflation Expectations survey. It will hardly provide any new information. The most optimal scenario for buying the euro will be the formation of a false breakout at 1.1373. The euro/dollar pair may go down to this level just after the publication of US macro statistics. An equally crucial task for the bulls during the American session will be to hold control over the level of 1.1413. Yesterday, the bulls failed to do so. Moving averages are also located just above this range, which may prevent a sharp recovery of the pair. A breakout of this range and a downward test will give additional entry points to buy the euro. It may also help the price return to 1.1452. However, the bulls will hardly stop there. Their main goal is a monthly high. The breakout and an upward test of 1.1452 will open the way to 1.1491 and 1.1562. I recommend locking in profits at this range. If the pair falls during the American session and there is no activity at 1.1372, it would be better to cancel buying until 1.1336. Bulls have tried to break through this level twice in the last few days. However, I would advise you to open long positions there if there is a formation of a false breakout. You can buy the euro immediately at a drop from the level of 1.1307, bearing in mind an upward intraday correction of 20-25 pips.
What is needed to open short positions on EUR/USD
The bears are sitting on the sidelines now. They failed to gain momentum following economic reports on Germany and the speech of ECB Executive Board member Frank Elderson. However, an attempt to push the pair to yesterday's lows clearly indicates a bearish market. Hence, in the second half of the day, bulls will try to regain control of 1.1413 as US economic reports are likely to support their efforts. Bears need to defend this level. If the price rises above 1.1413, then there will be an upward reversal. Strong US data and the formation of a false breakout at 1.1413 may increase pressure on the pair and form an entry point into short positions. In this case, EUR/USD may decrease to the 1.1372 level. A breakout and an upward test of this level will give an additional signal to open short positions with the prospect of a fall to 1.1336. A more distant target level will be 1.1307. I recommend locking in profits at this level. If the euro climbs and there is no activity at 1.1413, it is better not to rush to open short positions. The most sensible solution to sell EUR/USD would be selling straight after the formation of a false breakout at a high of 1.1452. I would advise you to sell EUR/USD immediately on a rebound from the monthly high of 1.1491 or even a higher high of around 1.1562. bearing in mind a downward correction of 15-20 pips.

COT report
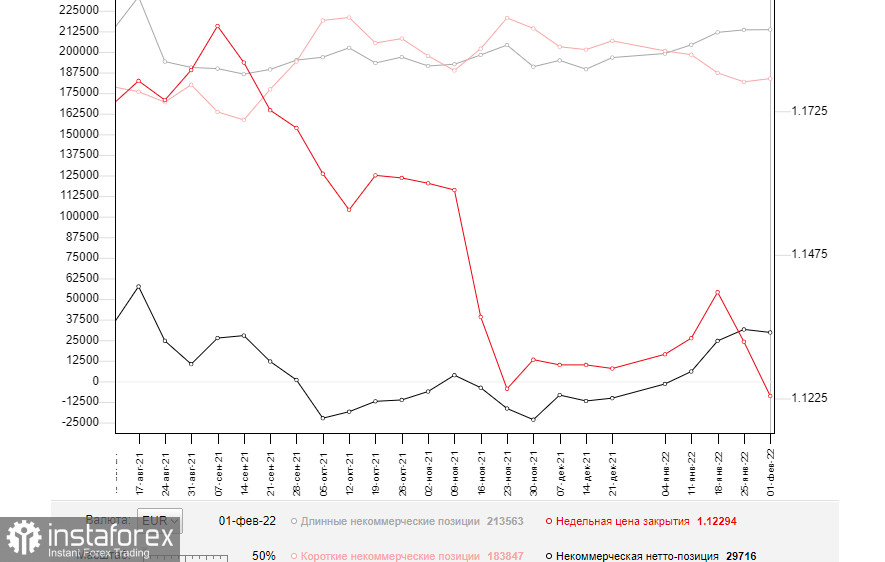
The COT report from February 1 showed an increase both in long and short positions, though the short ones grew to a bit larger degree. This enabled a modest contraction of the positive delta. However, we should understand that the data does not take into account the ECB policy meeting where President Christine Lagarde sent a clear message across financial markets. The regulator is determined to take a hawkish stance if high inflation persists. Meanwhile, the recent EU CPI data confirmed that inflation hit historic highs. So, inflationary pressure will hardly ease in the foreseeable future. This is a strong bullish signal for EUR, suggesting buying for the time being. Fundamentally, traders are now aware that the ECB has revised its policy towards monetary tightening with a possible rate hike this year. However, the Fed is also expected to raise the benchmark rate in March this year, which will be bearish for EUR/USD. Some analysts believe that the central bank may resort to a more aggressive stance and raise the key rate by 0.5% at once, rather than by 0.25%. The US dollar is sure to take advantage of it. The COT report revealed that the number of long non-commercial positions rose to 213,563 from 213,408, while the number of short non-commercial positions jumped to 183,847 from 181,848. It means that traders continue to increase long positions. Hence, the future report will clearly indicate bullish momentum as traders have already priced in the results of the ECB meeting. At the end of the week, the total non-commercial net position decreased slightly and amounted to 29,716 against 31,569. The weekly closing price also dropped to 1.1229 against 1.1323 a week earlier.

Signals of technical indicators
Moving averages
EUR/USD is trading below 30- and 50-period moving averages. It signals a sideways movement of the pair with a slight bearish bias.
Remark. The author is analyzing a period and prices of moving averages on the 1-hour chart. So, it differs from the common definition of classic daily moving averages on the daily chart.
Bollinger Bands
In case of a decline, the 1.1355 level will act as support. If the price rises, the 1.1485 level will act as resistance.
Definitions of technical indicators
- Moving average recognizes an ongoing trend through leveling out volatility and market noise. A 50-period moving average is plotted yellow on the chart.
- Moving average identifies an ongoing trend through leveling out volatility and market noise. A 30-period moving average is displayed as the green line.
- MACD indicator represents a relationship between two moving averages that is a ratio of Moving Average Convergence/Divergence. The MACD is calculated by subtracting the 26-period Exponential Moving Average (EMA) from the 12-period EMA. A 9-day EMA of the MACD called the "signal line".
- Bollinger Bands is a momentum indicator. The upper and lower bands are typically 2 standard deviations +/- from a 20-day simple moving average.
- Non-commercial traders - speculators such as retail traders, hedge funds and large institutions who use the futures market for speculative purposes and meet certain requirements.
- Non-commercial long positions represent the total long open position of non-commercial traders.
- Non-commercial short positions represent the total short open position of non-commercial traders.
- The overall non-commercial net position balance is the difference between short and long positions of non-commercial traders.
 English
 Русский
 Bahasa Indonesia
 Bahasa Malay
 ไทย
ไทย Español
 Deutsch
 Български
 Français
 Tiếng Việt
 中文
中文 বাংলা
বাংলা हिन्दी
 Čeština
 Українська
 Română

