To open long positions on GBP/USD, you need:
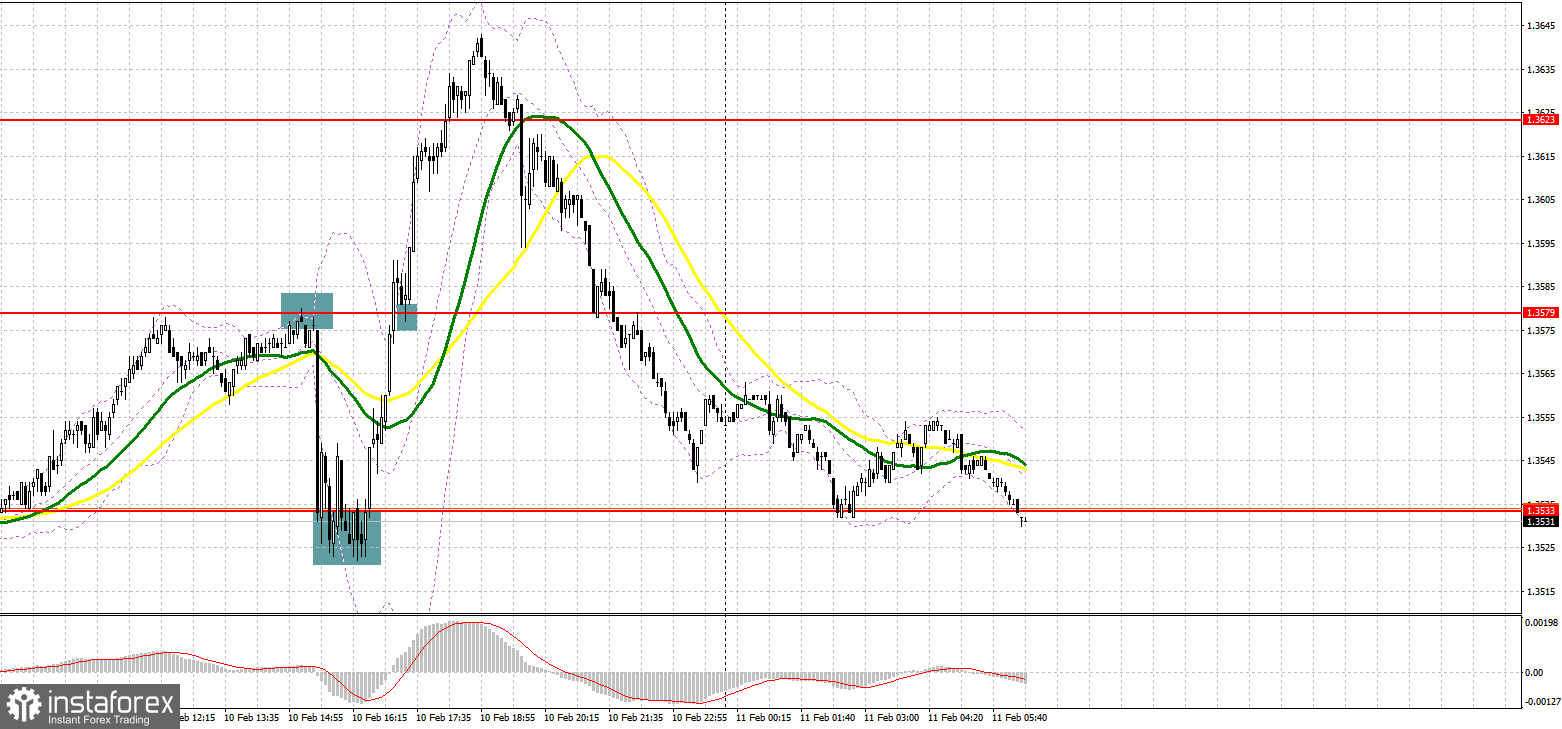
Yesterday, several interesting signals were formed to enter the market. Let's take a look at the 5-minute chart and figure out what happened. In my morning forecast, I paid attention to the 1.3350 level and recommended making decisions on entering the market from it. I said that the lack of fundamental statistics will keep the demand for the pound. As it turned out, there are a lot more people willing to buy before important statistics on the US are released. The bulls achieved a breakthrough and consolidation above 1.3350, and the reverse test from top to bottom resulted in creating a signal to open long positions. As a result, the growth was about 30 points. Before the release of data on the US economy, the bears were already active in the area of 1.3579, which led to forming a sell signal and the pound fell by more than 70 points. And if it was rather inconvenient to buy from the 1.3533 level – since the bearish movement was expected to continue, then after a sharp increase and consolidation above 1.3579, as well as a test of this level from top to bottom, a good buy signal was formed. As a result, the growth was more than 50 points.

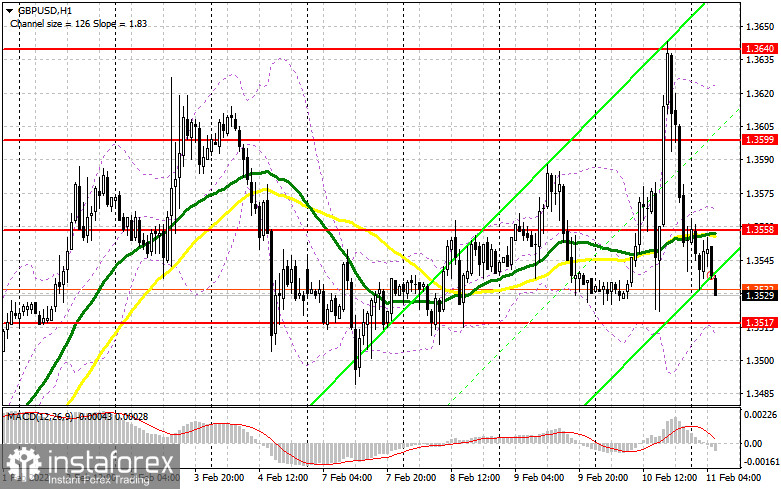
They rushed to buy the British pound. However, after the weekly highs were updated, the pressure on the pair returned very quickly, which led to a return to the weekly channel. A number of important fundamental statistics for the UK are coming out today, which will determine the pound's direction for the first half of the day. It is important to protect the support of 1.3517 today. We can still count on the resumption of the bull market from this range by analogy with yesterday, but very strong data on changes in the volume of UK GDP and changes in industrial production are required - unfortunately, weak reports are expected. Forming a false breakout at 1.3517 will provide the first entry point into long positions. An equally important task is a breakthrough and a top-down test of 1.3558, where the moving averages are already playing on the bears' side. This will provide another buy signal with the goal of returning to 1.3599, and the February highs in the area of 1.3640 and 1.3683, where I recommend taking profits, will act as a target. It will be possible to reach these levels only if we receive disappointing data on the US economy in the afternoon. In case GBP/USD falls during the European session and traders are not active at 1.3517, it is better not to rush into buying risky assets. I advise you to wait for the test of the next major level of 1.3477. Forming a false breakout there will provide an entry point to long positions. You can buy the pound immediately for a rebound from 1.3445, or even lower - from a low of 1.3407, counting on a correction of 20-25 points within the day.
To open short positions on GBP/USD, you need:
The bears did not allow them to settle at monthly highs, which indicates clear plans to turn the market in their direction. Today's data on the state of the UK economy will help with this. The task is to protect the 1.3558 level, on which a lot depends. The averages are moving there, so an unsuccessful consolidation above this range, together with weak statistics on UK GDP, all this creates the first entry point into short positions, counting on a further downward correction to the lower border of the 1.3517 horizontal channel formed this week. A breakthrough and test of 1.3517 from the bottom up in the first half of the day will lead to a major drop in the pound to the area of lows: 1.3477 and 1.3445, where I recommend taking profits. If the pair grows during the European session and bears are weak at 1.3558, it is best to postpone short positions until the next major resistance at 1.3599. I also advise you to open short positions there only in case of a false breakout. You can sell GBP/USD immediately for a rebound from a new high of 1.3640, or even higher - from the 1.3683 area, counting on the pair's rebound down by 20-25 points within the day.

I recommend for review:
The Commitment of Traders (COT) report from February 1 showed a sharp increase in short positions and a drop in long ones. This enabled a modest contraction of the positive delta. However, we should understand that the data does not take into account the BoE policy meeting where the regulator hiked the key rate. Nevertheless, it did not help the pound to develop a rally. Traders are well aware that the regulator took a tougher stance on monetary policy to curb rising inflation. Given that the UK economy is going through hard times and at any moment the pace of economic growth may slow down, the British currency did not advance considerably following the interest rate hike. On top of that, the Fed is also expected to raise the benchmark rate in March this year, which will be bearish for GBP/USD. Some analysts believe that the central bank may resort to a more aggressive stance and raise the key rate by 0.5% at once, rather than by 0.25%. The US dollar is sure to take advantage of it. The COT report from February 1 revealed that the number of long non-commercial positions decreased to 29,597 from 36,666, while the number of short non-commercial positions rose to 53,202 from 44,429. This led to an even greater increase in the negative non-commercial net position to -23,605 from -7,763. The weekly closing price declined to 1.3444 from 1.3488.
Indicator signals:
Trading is conducted in the area below the 30 and 50 moving averages, which indicates an attempt by bears to resume the fall of the pound.
Moving averages
Note: The period and prices of moving averages are considered by the author on the H1 hourly chart and differs from the general definition of the classic daily moving averages on the daily D1 chart.
Bollinger Bands
A breakthrough of the average border of the indicator in the area of 1.3560 will lead to an increase in the pound. Crossing the lower limit in the area of 1.3505 will increase the pressure on the pair.
Description of indicators
- Moving average (moving average, determines the current trend by smoothing out volatility and noise). Period 50. It is marked in yellow on the chart.
- Moving average (moving average, determines the current trend by smoothing out volatility and noise). Period 30. It is marked in green on the chart.
- MACD indicator (Moving Average Convergence/Divergence — convergence/divergence of moving averages) Quick EMA period 12. Slow EMA period to 26. SMA period 9
- Bollinger Bands (Bollinger Bands). Period 20
- Non-commercial speculative traders, such as individual traders, hedge funds, and large institutions that use the futures market for speculative purposes and meet certain requirements.
- Long non-commercial positions represent the total long open position of non-commercial traders.
- Short non-commercial positions represent the total short open position of non-commercial traders.
- Total non-commercial net position is the difference between short and long positions of non-commercial traders.
 English
 Русский
 Bahasa Indonesia
 Bahasa Malay
 ไทย
ไทย Español
 Deutsch
 Български
 Français
 Tiếng Việt
 中文
中文 বাংলা
বাংলা हिन्दी
 Čeština
 Українська
 Română

