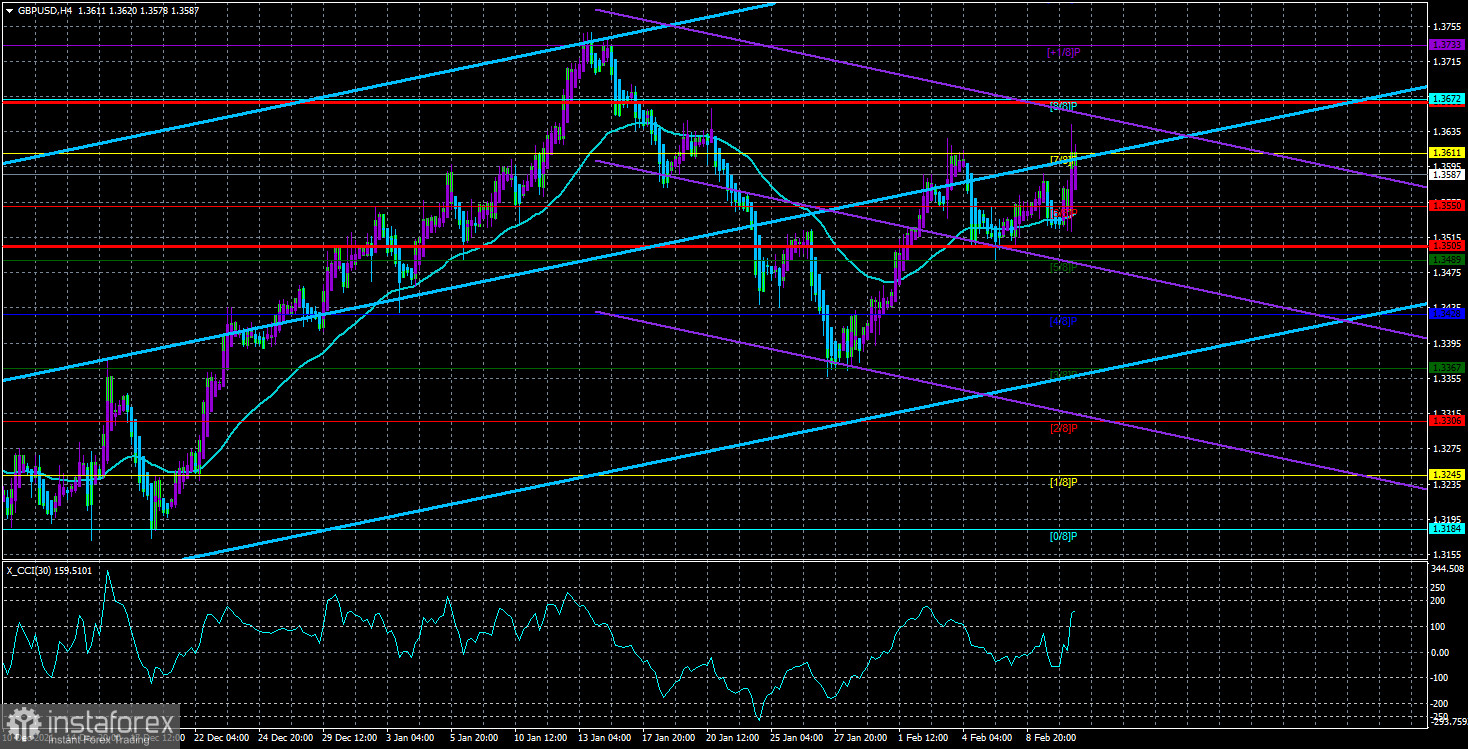
The GBP/USD currency pair on Thursday, unfortunately, continued to trade in its manner, which was formed this week. Namely: multidirectional movements with low volatility in the absence of a pronounced, even intraday trend. We observed exactly such movements of the pair on Thursday. The pair initially grew and managed to add about 50 points, then collapsed down by 50 points in just an hour, and then rose again by the same 50 points. Moreover, if the pair's fall was due to a strong inflation report in the US, then it is quite difficult to explain what caused the pair's two 50-point increases during the day. This is especially true of the second round of growth, which began half an hour after the publication of the inflation report. At first, traders reacted to the growing inflation in America, and then immediately retreated from their position, which allowed the pair to return to its original positions. How to explain it? This can be explained in the same way as the slurred movement, in general, this week. There is a feeling that traders now do not understand what to do with the pair, so the direction of movement is constantly changing, which greatly complicates the trading process even within the day. As for the 4-hour timeframe, the picture on it is also very eloquent. The pair continues to trade above the moving average line, but the line itself is directed almost sideways, which indicates that there is no trend movement at this time. Recall that an ambiguous picture has also developed on the 24-hour timeframe. The price simply ignores the Kijun-sen line, crossing it almost every day. Well, how can we not remember about the COT reports, which also show a constant change of mood among professional players?
Rising inflation in the US increases the likelihood of a 0.5% rate hike in March.
This week, several representatives of the Fed made comments on the monetary policy of the regulator this year. For example, the head of the Federal Reserve Bank of Atlanta, Rafael Bostic, said that he expects 3-4 rate hikes this year. And, I must say, this is the lowest forecast for the number of rate increases. For example, Deutschebank believes that there will be 7 rate increases. The same opinion is shared by Bank of America. Given the fact that the main indicator for the Fed is now inflation, it is not surprising that all the attention of traders on Thursday was focused on this report. And, I must say, it managed to impress the markets. The consumer price index rose to 7.5% in January, exceeding the forecast by 0.2% and the previous value by 0.5%. Thus, inflation continues to accelerate, without paying any attention to the curtailment of the quantitative stimulus program. This only means that we have already said more than once: it will be an extremely difficult task to repay inflation now and bring it back to 2%. A task that may take several years to complete. The Fed, led by Jerome Powell, has refused for too long to take into account the entire threat of rising prices, believing that this problem will solve itself as soon as problems with supply chains, growing demand, and rising energy prices are eliminated. However, oil continues to rise in price, the pandemic continues to terrorize humanity, and the demand for goods and services is growing in the United States, as the money supply has almost doubled in the country over the past two years. Since money has become trite, it is not surprising that prices are rising, because there are no more goods and services. Since the price of oil is rising, it is not surprising that prices are rising for everything where oil and petroleum products are used (for example, gasoline). Well, the supply chain is a separate song. It is unlikely that the problems with them will be completely solved until the pandemic ends.

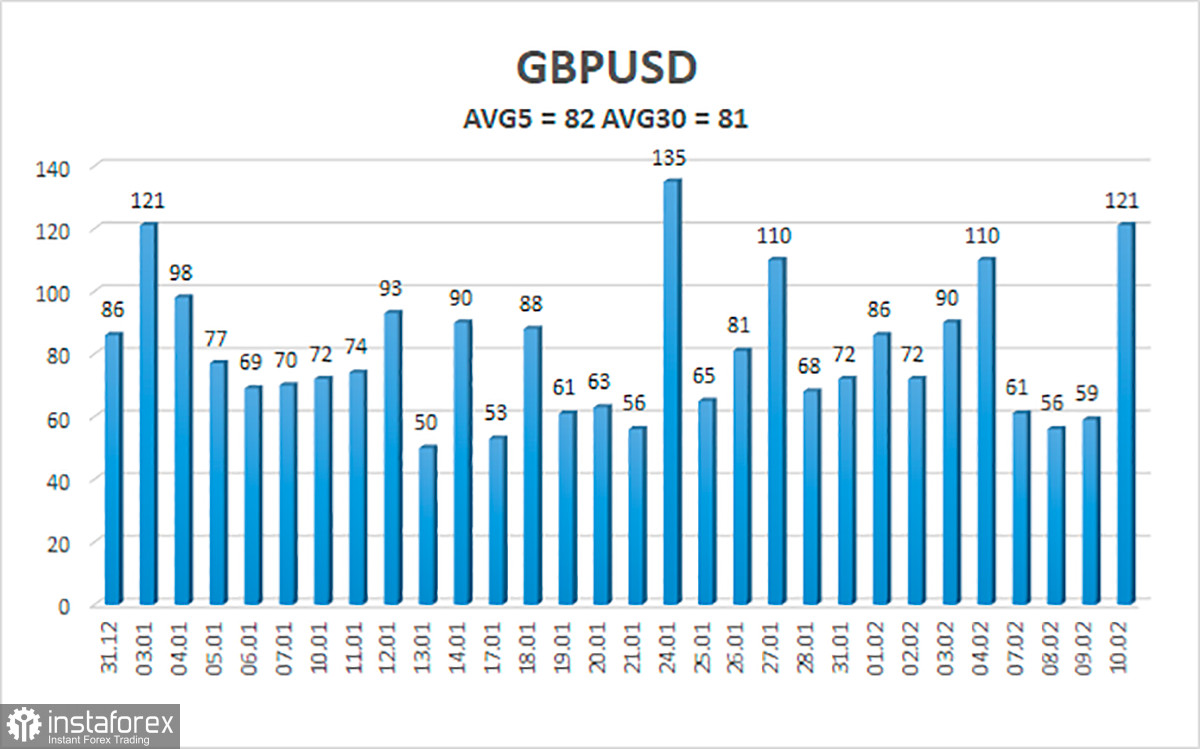
The average volatility of the GBP/USD pair is currently 82 points per day. For the pound/dollar pair, this value is "average". On Friday, February 11, thus, we expect movement inside the channel, limited by the levels of 1.3505 and 1.3668. The reversal of the Heiken Ashi indicator downwards signals the resumption of a downward correction.
Nearest support levels:
S1 – 1.3550
S2 – 1.3489
S3 – 1.3428
Nearest resistance levels:
R1 – 1.3611
R2 – 1.3672
R3 – 1.3733
Trading recommendations:
The GBP/USD pair resumed its upward movement on the 4-hour timeframe, after a rebound from the moving average. Thus, at this time it is recommended to stay in long positions with a target of 1.3672 until the Heiken Ashi indicator turns down. It is recommended to consider short positions if the pair is fixed below the moving average, with targets of 1.3505 and 1.3489.
Explanations to the illustrations:
Linear regression channels - help to determine the current trend. If both are directed in the same direction, then the trend is strong now.
Moving average line (settings 20.0, smoothed) - determines the short-term trend and the direction in which trading should be conducted now.
Murray levels - target levels for movements and corrections.
Volatility levels (red lines) - the likely price channel in which the pair will spend the next day, based on current volatility indicators.
CCI indicator - its entry into the oversold area (below -250) or into the overbought area (above +250) means that a trend reversal in the opposite direction is approaching.
 English
 Русский
 Bahasa Indonesia
 Bahasa Malay
 ไทย
ไทย Español
 Deutsch
 Български
 Français
 Tiếng Việt
 中文
中文 বাংলা
বাংলা हिन्दी
 Čeština
 Українська
 Română

