To open long positions on GBP/USD, you need:
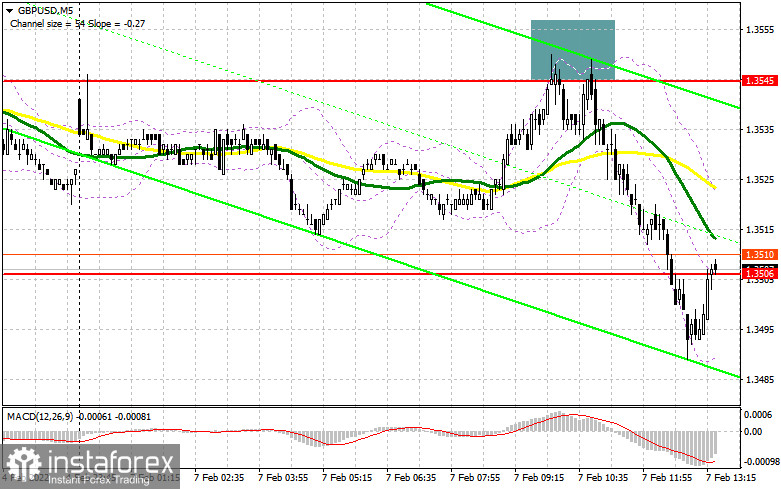
In my morning forecast, I paid attention to the resistance of 1.3545 and recommended that decisions on entering the market be made from it. Let's look at the 5-minute chart and figure out what happened. Several unsuccessful attempts by bulls to get above 1.3545 led to the formation of excellent signals for the sale of the pound. As a result, the pair collapsed by more than 60 points, which led to a breakdown of the 1.3506 support. In the afternoon, serious activity will start around this range. And what were the entry points for the euro this morning?

During the American session, we are not waiting for important data, and the lending reports will be passing. The bears are counting on maintaining pressure on the pair, so buyers will need to try very hard to regain the level of 1.3506.
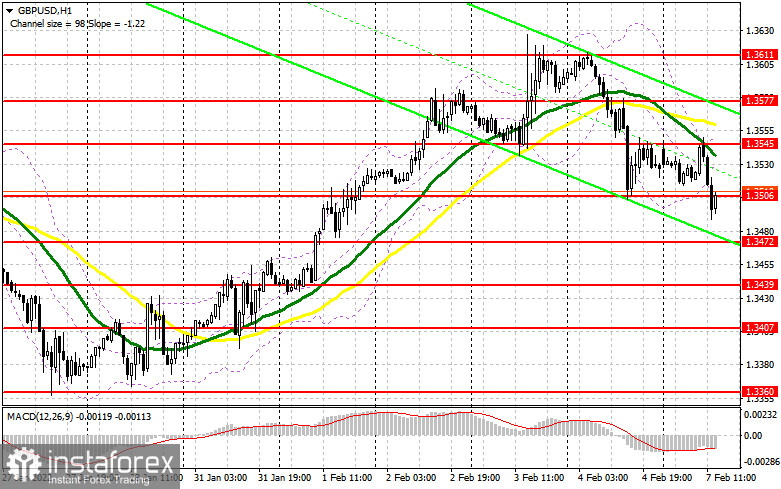
An equally important task for bulls today will be to protect the support of 1.3472 since by releasing the pound to this minimum, they risk completely losing control of the upward trend observed last week. From this range, you can count on the growth of GBP/USD, but you need to form a false breakdown. Only this will form the first entry point into long positions, and weak data on lending in the US will return demand for the British pound. As noted above, buyers urgently need to go above the 1.3506 level. Only a test of this range from top to bottom will give an additional buy signal with a rise to 1.3545, where the moving averages are playing on the side of the bears. A more difficult task will be updating 1.3577 and 1.3611, however, this is not today. I recommend fixing profits there. Under the scenario of a decline in GBP/USD during the US session, after weak strong fundamental data and lack of activity at 1.3472, it is better not to rush into buying risky assets. I advise you to wait for the test of the next major level 1.3439. Only the formation of a false breakdown will give an entry point into long positions. You can buy the pound immediately for a rebound from 1.3407, or even lower - from this month's minimum of 1.3360, counting on a correction of 20-25 points within a day.
To open short positions on GBP/USD, you need:
Bears prove the fact of market control after Friday's fall, but so far it is not possible to take the initiative at the base of the 35th figure until the end. A lot will depend on whether the market will be able to close above 1.3506 or not. The primary task of sellers is to protect this range. The formation of a false breakdown together with strong statistics on lending in the US – all this forms another entry point into short positions by analogy with the morning sale, which I analyzed above. In this case, we can count on the continuation of the bear market and the pair's decline to the area of major support at 1.3472. A breakdown and test of this range from the bottom up will give an additional entry point for the sale of the pound to fall to 1.3439 and 1.3407, where I recommend fixing the profits. If the pair grows during the American session, as well as weak sellers' activity at 1.3506, it is best to postpone sales until the morning resistance of 1.3545. I advise you to open short positions there also in case of a false breakdown. You can sell GBP/USD immediately for a rebound from 1.3577, or even higher - from the maximum in the area of 1.3611, counting on the pair's rebound down by 20-25 points within a day.

The COT reports (Commitment of Traders) for January 25 recorded an increase in short positions and a sharp reduction in long ones. All this has led to a return of the market to the sellers' side, but this week the situation may change dramatically. As the bears did not try to continue the downward trend, it turned out quite badly. The sellers were not helped by the statements of the Federal Reserve System after the monetary policy meeting that the regulator would start raising interest rates in the United States in March. Most likely, the demand for the pound will gradually recover, as a meeting of the Bank of England committee will be held this Thursday, at which it will be decided to raise interest rates. However, the pressure on the pound will remain due to the observed fundamental picture, which creates several more serious moments limiting the upward potential. However, if you look at the overall picture, the prospects for the British pound look pretty good, and the observed downward correction makes it more attractive. In any case, the Bank of England's decision to raise interest rates further this year will push the pound to new highs. The COT report for January 25 indicated that long non-commercial positions decreased from the level of 39,760 to the level of 36,666, while short non-commercial positions increased from the level of 40,007 to the level of 44,429. This led to a fall in the negative non-commercial net position from -247 to -7,763. The weekly closing price dropped from the level of 1.3647 to the level of 1.3488.
Signals of indicators:
Moving averages
Trading is conducted below 30 and 50 daily moving averages, which indicates the continuation of the pound's decline.
Note: The period and prices of moving averages are considered by the author on the hourly chart H1 and differ from the general definition of the classic daily moving averages on the daily chart D1.
Bollinger Bands
In the case of growth, the upper limit of the indicator around 1.3545 will act as resistance.
Description of indicators
- Moving average (moving average determines the current trend by smoothing out volatility and noise). Period 50. The graph is marked in yellow.
- Moving average (moving average determines the current trend by smoothing out volatility and noise). Period 30. The graph is marked in green.
- MACD indicator (Moving Average Convergence / Divergence - moving average convergence/divergence) Fast EMA period 12. Slow EMA period 26. SMA period 9
- Bollinger Bands (Bollinger Bands). Period 20
- Non-profit speculative traders, such as individual traders, hedge funds, and large institutions that use the futures market for speculative purposes and meet certain requirements.
- Long non-commercial positions represent the total long open position of non-commercial traders.
- Short non-commercial positions represent the total short open position of non-commercial traders.
- Total non-commercial net position is the difference between the short and long positions of non-commercial traders.
 English
 Русский
 Bahasa Indonesia
 Bahasa Malay
 ไทย
ไทย Español
 Deutsch
 Български
 Français
 Tiếng Việt
 中文
中文 বাংলা
বাংলা हिन्दी
 Čeština
 Українська
 Română

