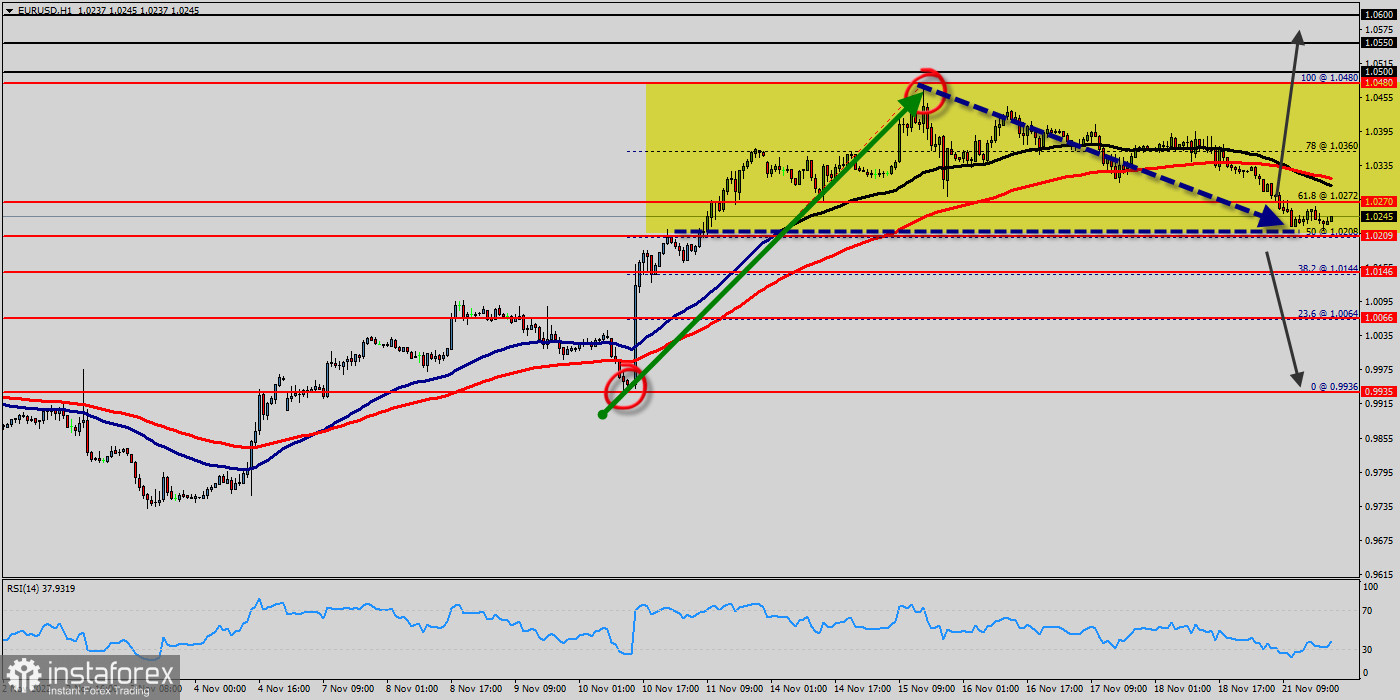
The EUR/USD pair traded in different directions in the range of 1.0360 - 1.0209 and closed the day without significant changes. Today it fell a little, dropping from the top price of 1.0360 to 1.0245. The EUR/USD pair stayed below the psychological level of 1.0270 over the weekend, indicating a lack of urgency to accumulate at the current levels. The bears are attempting to extend the EUR/USD pair's decline below 1.0270 in the week beginning of this week. Following the price of 1.0270 rejection, the seller takers still have the upper hand in the market, as they were able to impose more correction on the EUR/USD pair from the price of 1.0270. The EUR/USD pair couldn't reach stiff resistance at 1.0360 and pulled back near 1.0270 support, which could be a swing entry opportunity. On the hourly chart, the EUR/USD pair is still trading below the MA (100) H1 moving average line (1.0270). The situation is similar on the one-hour chart. Based on the foregoing, it is probably worth sticking to the north direction in trading, and as long as the EUR/USD pair remains below MA 100 H1, it may be necessary to look for entry points to buy for the formation of a correction. The EUR/USD pair slides below 1.0270 mark amid rebounding oil prices, modest USD weakness. The EUR/USD pair maintained its offered tone through the early European session and slipped below the 1.0270 psychological mark, hitting a fresh daily low in the last three hour at the price of 1.0209. The RSI is still signaling that the trend is downward as it is still strong below the moving average (100). Additionally, the RSI starts signaling a downward trend.
Technical outlook :
The EUR/USD pair faced resistance at the level of 1.0360, while minor resistance is seen at 1.0270. Support is found at the levels of 1.0209 and 1.0146. Pivot point has already been set at the level of 1.0270. Equally important, the EUR/USD pair is still moving around the key level at 1.0270, which represents a minor resistance in the H1 time frame at the moment. Yesterday, the EUR/USD pair continued moving downwards from the level of 1.0270. The pair will to the bottom around 1.0209 from the level of 1.1531 (coincides with the ratio of 50% Fibonacci retracement). In consequence, the EUR/USD pair broke support, which turned into strong resistance at the level of 1.0360. The level of 1.0270 is expected to act as the minor resistance today. We expect the EUR/USD pair to continue moving in the bearish trend towards the target levels of 1.0209 and 1.0144.
On the downtrend:
If the pair fails to pass through the level of 1.0270, the market will indicate a bearish opportunity below the level of 1.0270. Moreover, a breakout of that target will move the pair further downwards to 1.0209 in order to form a new double bottom. So, the market will decline further to 1.0209 and 1.0144. On the other hand, if a breakout happens at the support level of 1.0360, then this scenario may be invalidated.
 English
 Русский
 Bahasa Indonesia
 Bahasa Malay
 ไทย
ไทย Español
 Deutsch
 Български
 Français
 Tiếng Việt
 中文
中文 বাংলা
বাংলা हिन्दी
 Čeština
 Українська
 Română

