EUR/USD

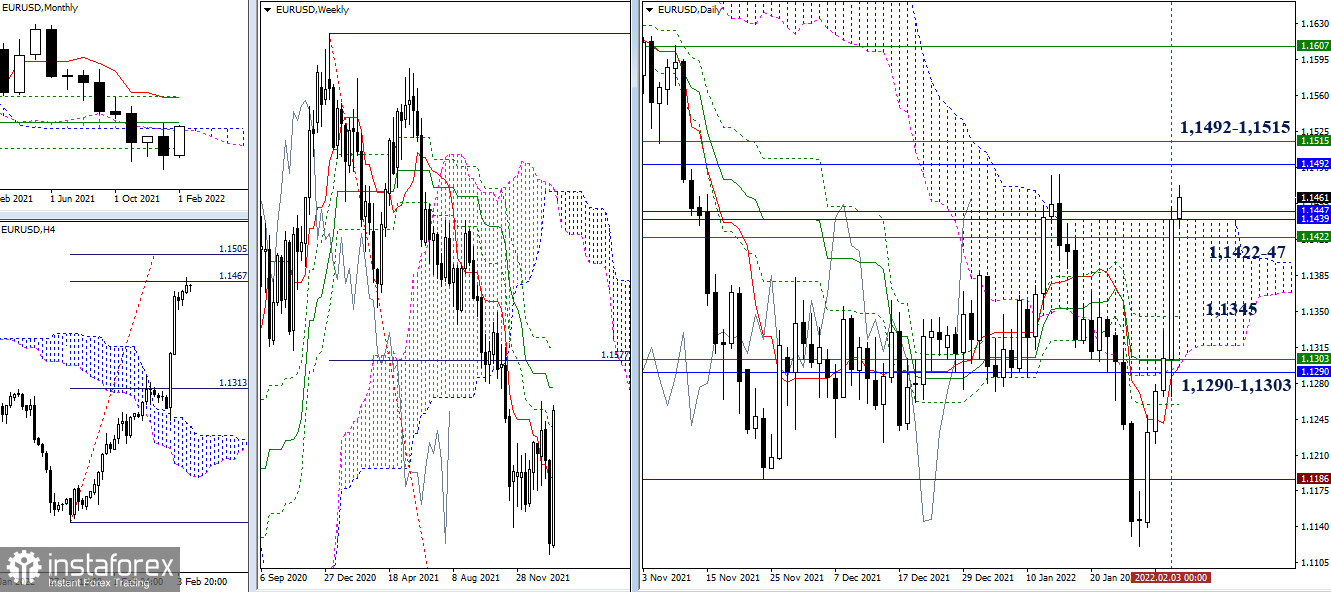
The bulls did not stay in the area of accumulation of levels (1.1290 - 1.1303) for a long time and so, it broke through the next important combination of resistances, which was previously noted within the range of 1.1422 - 1.1447 (the upper limit of the daily cloud + weekly level + monthly cloud). Further, the closest levels in the range are medium-term trends of weeks and months (1.1492 - 1.1515).
The current trading week will be closed today. The bulls managed not only to balance the advantage of the opponent a week ago but also to cancel the gains the entire last month. The breakdown of the encountered borders will strengthen the bulls, which will open up new prospects for them.

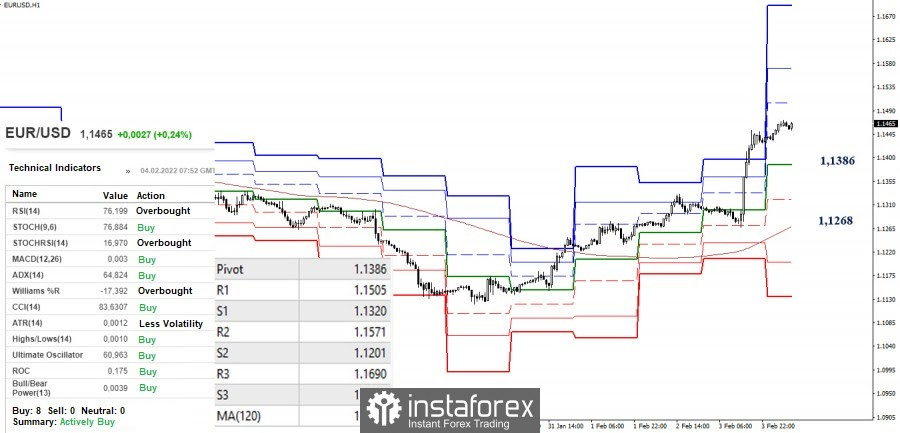
Yesterday, the bulls ended their downward correction and resume their growth. Now, the upward targets in the smaller timeframes are set at 1.1505 - 1.1571 - 1.1690 (classic pivot levels). If the correction develops again next time, the central pivot level (1.1386) will serve as the nearest important support, and then the interests of the bears will be aimed at declining and testing the key level of the weekly long-term trend (1.1268). The nearest support level can be noted at 1.1320 (S1).
GBP/USD

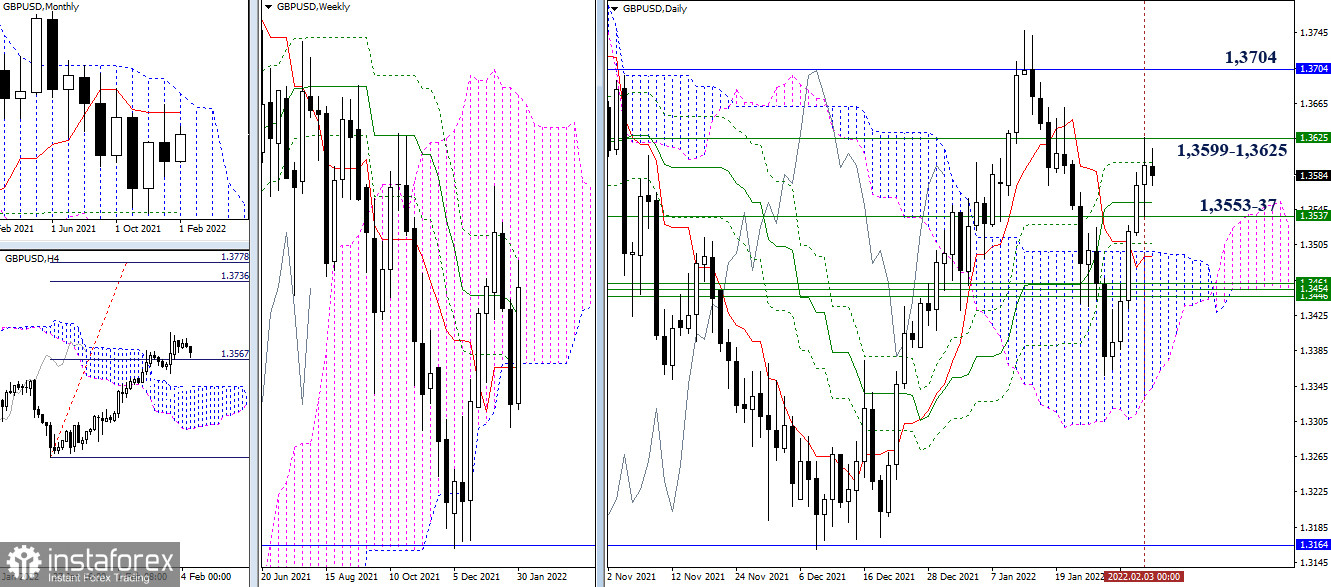
The bulls showed a slowdown after meeting the resistance zone of the final borders of the daily (1.3599) and weekly (1.3625) Ichimoku dead crosses. When testing this zone, they limited themselves to a long upper shadow and closed the day below the levels. As a result, the task of the bulls to break through the dead crosses is still the main one in the current situation. The next resistance is currently located at 1.3704 (monthly short-term trend), and the nearest supports are in the area of 1.3553-37 (weekly and daily medium-term trend).

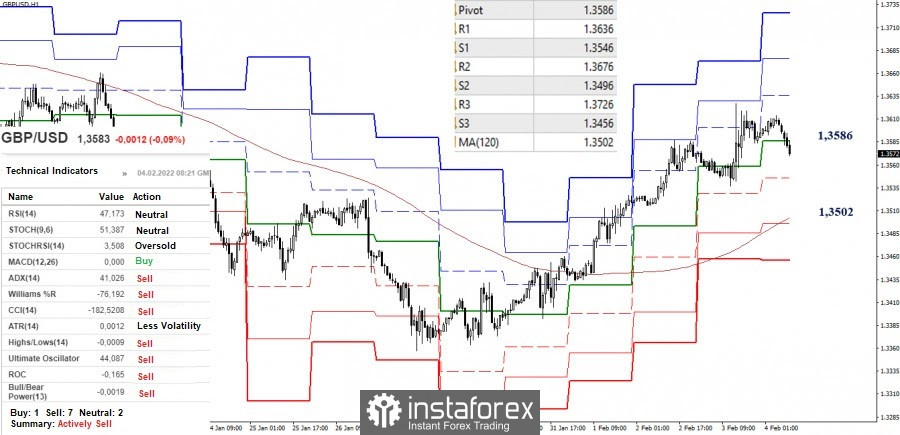
There is another downward correction in the smaller timeframes. The bears overcame the central pivot level (1.3586), so the next important pivot point is the weekly long-term trend (1.3502). The closest support is at 1.3546 (S1). But if the correction ends again, and the bulls manage to further rise, then we can consider the intraday upward pivot points at 1.3636 - 1.3676 - 1.3726 (classic pivot levels).
***
Ichimoku Kinko Hyo (9.26.52) and Kijun-sen levels in the higher time frames, as well as classic Pivot Points and Moving Average (120) on the H1 chart, are used in the technical analysis of the trading instruments.
 English
 Русский
 Bahasa Indonesia
 Bahasa Malay
 ไทย
ไทย Español
 Deutsch
 Български
 Français
 Tiếng Việt
 中文
中文 বাংলা
বাংলা हिन्दी
 Čeština
 Українська
 Română

