Here are the details of the economic calendar for February 3:
Yesterday was the busiest day of the week, as two meetings of the Central Banks took place at once.
The Bank of England continued to tighten monetary policy by raising the refinancing rate from 0.25% to 0.50%. This step led to another speculation, which resulted in the pound's local surge. The regulator also voted unanimously to begin reducing the volume of purchases of UK government bonds, as well as the program of buying corporate bonds financed by the Central Bank's issuance.
Currency markets expect the Bank of England to continue raising interest rates, which could reach 1.25% by the end of the year.
The European Central Bank (ECB) expectedly kept the refinancing rate at zero, and it will keep it to this level until inflation reaches 2%. During the press conference, Christine Lagarde received statements about the readiness of the regulator to make changes to the current monetary policy. This signals that the ECB may change course much earlier than expected, which led to the euros' sharp growth.
ECB:
- PEPP purchases will be completed by the end of March, reinvestment will continue.
- PEPP purchases may be resumed if needed.
Survey:
- The markets assume the ECB rate hike by 0.40% by December 2022 (against 0.2% last week and 0.3% yesterday).
Lagarde:
- Inflation remains elevated longer than expected.
- Such an increase in inflation was a surprise.
- Inflation growth will continue longer than it was predicted.
Analysis of trading charts from February 3:
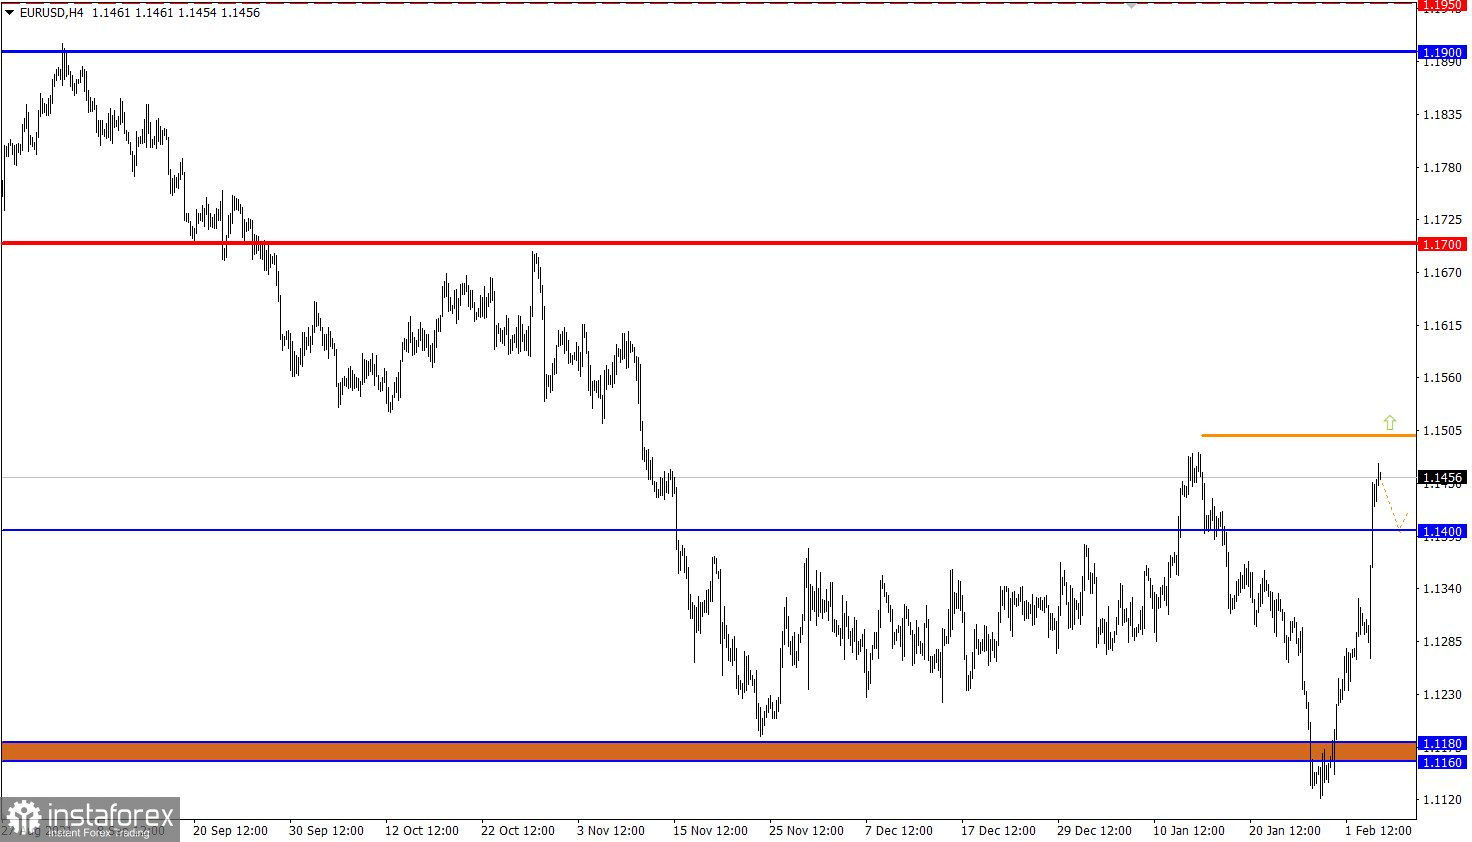
The EUR/USD pair has strengthened by 200 points in 24 hours. This led to an inertial growth, as a result of which important price levels were broken. The reason for such strong price changes lies not in technical analysis, but in the information noise that stimulates speculators to action.
There is a downward trend on the daily chart, where the usual correction may be reclassified into an oblong one. This process will lead to a change in the trend if several technical conditions are confirmed.
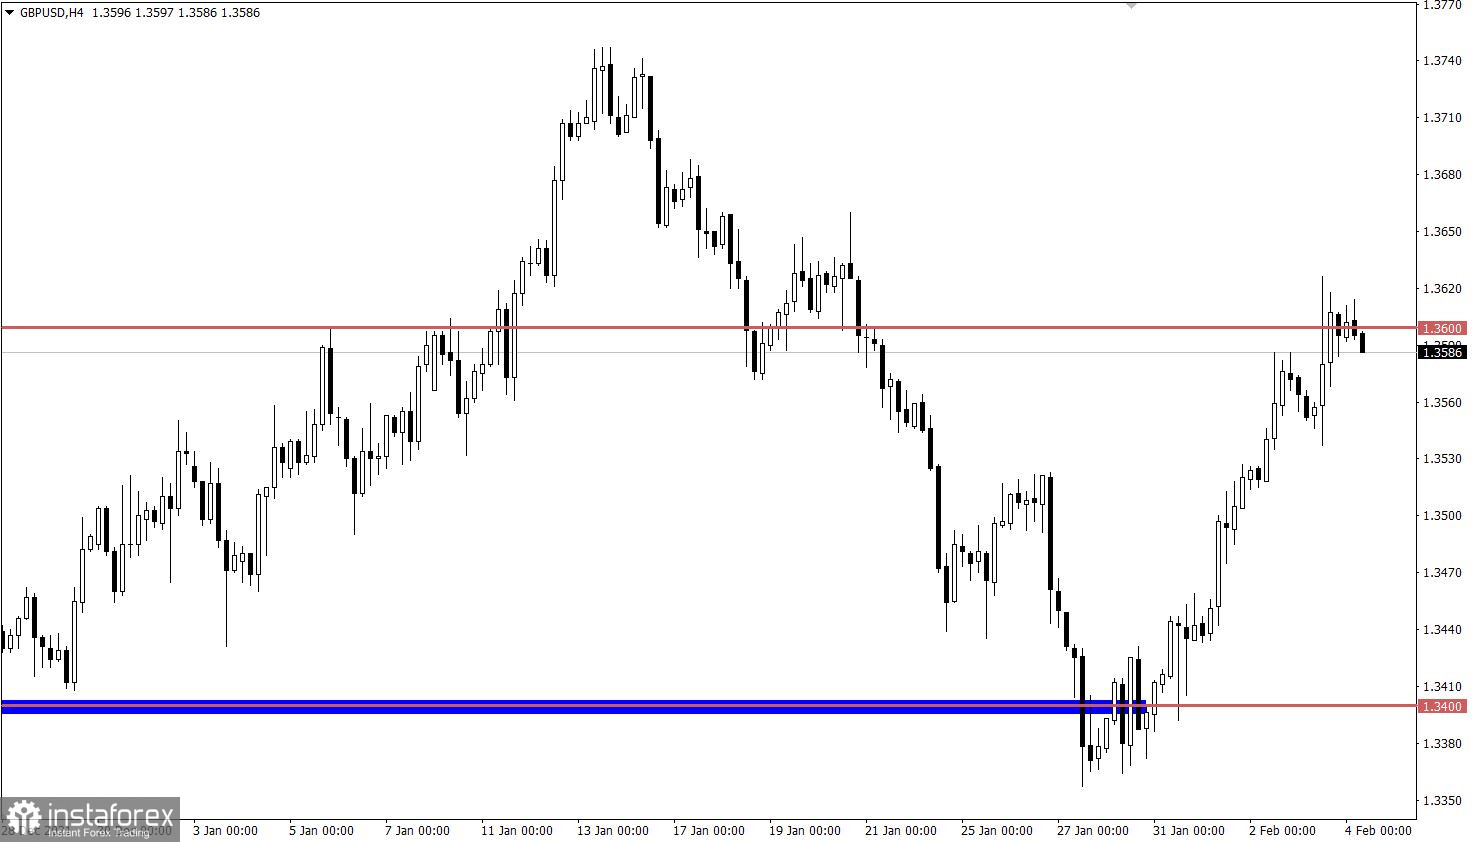
The GBP/USD pair reached the resistance level of 1.3600 during a sharp increase. There was a reduction in the volume of long positions in this area, which led to price stagnation along the reference level.

February 4 economic calendar:
Europe's retail sales will be published today, which are expected to decline from 7.8% to 5.1%. This is not the best signal for the economy, so the euro may be under local pressure when the data is released.
The primary event is the US Department of Labor report, which is likely to put pressure on the US dollar. Here, the unemployment rate is expected to remain unchanged, while 210 thousand new jobs can be created outside of agriculture. Everything would be fine if not for the ADP report, which showed a decline in employment by 301 thousand. Therefore, the report may be worse than expected, which will affect the US dollar.
Time targeting
EU retail sales - 10:00 Universal time
US Department of Labor Report - 13:30 Universal time
Trading plan for EUR/USD on Feb 4:
The inertial move returned the quote to the area of the local high on January 14, while the volume of long positions did not fall. This indicates that speculators continue to ignore signals from technical analysis. For the upward cycle to remain in the market, the quote needs to stay above the level of 1.1500. In this case, the signal of an oblong correction will be confirmed, which will attract additional attention from traders.
It is worth considering that the inertial course cannot be constant. Sooner or later, the critical moment of overheating of long positions in the euro will come. This will lead to their immediate reduction and technical correction concerning the upward cycle.

Trading plan for GBP/USD on Feb 4:
In this situation, we pay special attention to the movement along the 1.3600 level, since holding the price well above it will cause a subsequent growth in the daily timeframe. This step may trigger the process of changing trading interests, which will lead to an initial move towards the local high of 1.3747.
At the same time, the initial stagnation along the control level leaves a chance of a reversal, but this signal will be confirmed in the market only after the price is kept below the level of 1.3565.

What is reflected in the trading charts?
A candlestick chart view is graphical rectangles of white and black light, with sticks on top and bottom. When analyzing each candle in detail, you will see its characteristics of a relative period: the opening price, closing price, and maximum and minimum prices.
Horizontal levels are price coordinates, relative to which a stop or a price reversal may occur. These levels are called support and resistance in the market.
Circles and rectangles are highlighted examples where the price of the story unfolded. This color selection indicates horizontal lines that may put pressure on the quote in the future.
The up/down arrows are the reference points of the possible price direction in the future.
 English
 Русский
 Bahasa Indonesia
 Bahasa Malay
 ไทย
ไทย Español
 Deutsch
 Български
 Français
 Tiếng Việt
 中文
中文 বাংলা
বাংলা हिन्दी
 Čeština
 Українська
 Română

