The main news from the world of cryptocurrencies:
Fidelity has filed applications with the US Securities and Exchange Commission to launch two more cryptocurrencies ETFs. The funds will invest in cryptocurrency companies and metaverses. The Fidelity Metaverse ETF fund will invest in companies developing metaverses. The index will include shares of companies that receive more than 50% of profits from the development and promotion of metaverses, as well as the creation of games and devices in this area.
The second fund is called the Crypto Industry and Digital Payments ETF. This is a more "standard" cryptocurrency fund, the funds of which will be invested in companies operating in the cryptocurrency industry, developing blockchain-based products, and providing payments in digital currencies.
We continue to consider Bitcoin from the point of view of Elliott's theory on an hourly timeframe.
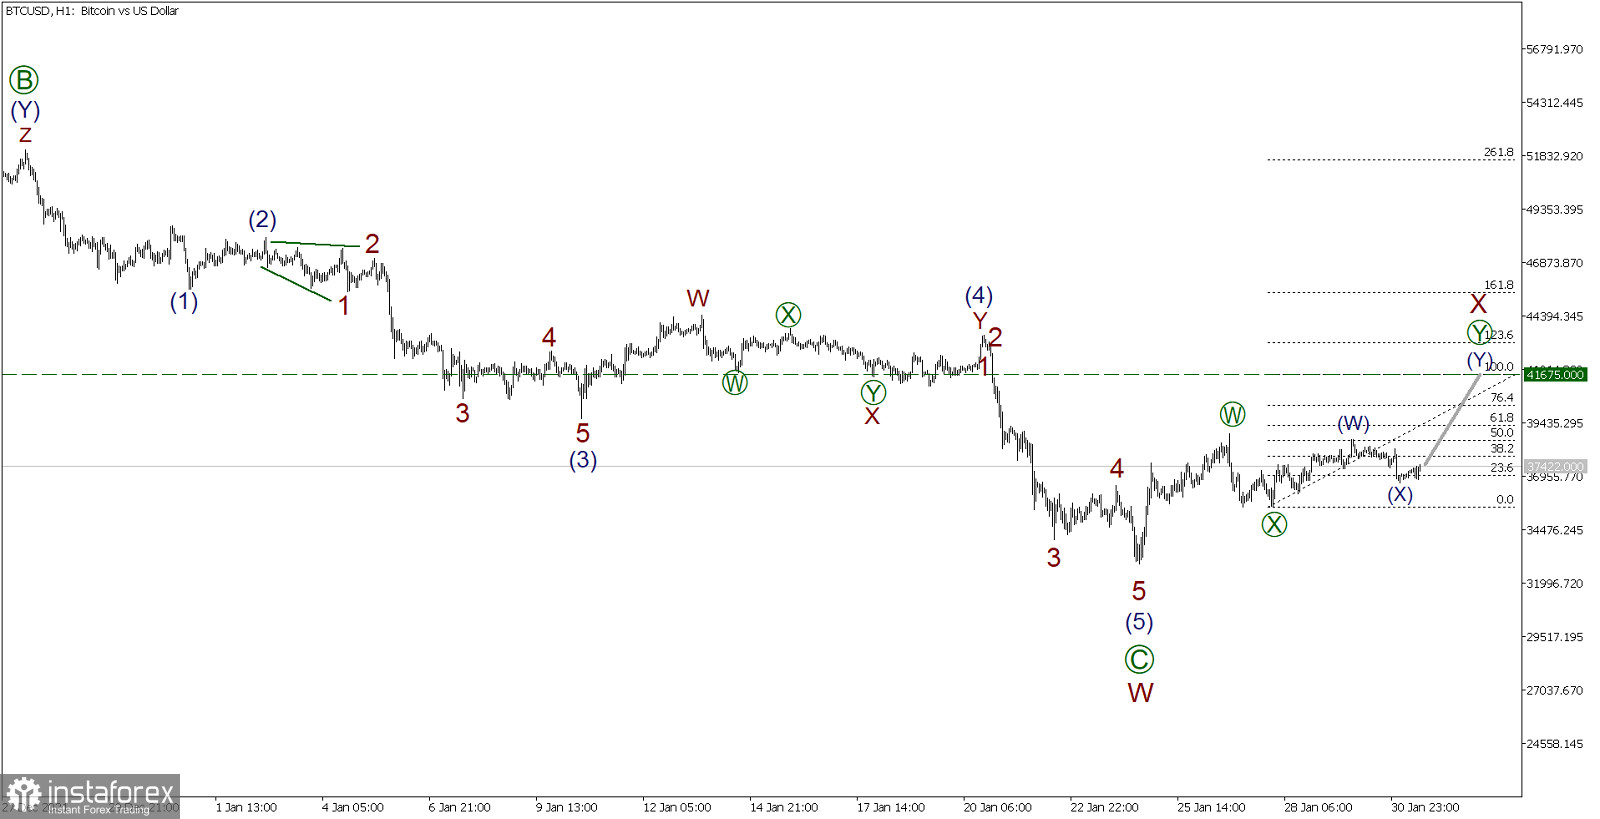
BTCUSD H1:

The formation of the BTCUSD cryptocurrency pair in the long term implies the development of a global upward correction trend, which can take the form of a simple zigzag. Perhaps the first half of this zigzag has already been completed. Currently, a bearish correction is in the process of developing, and most likely it will take the form of a double zigzag W-X-Y, where the W sub-wave looks completely completed.
Here we see that the descending wave W looks like a simple zigzag (A)-(B)-(C). The subwaves (A) and (C) are pulses, and the correction subwave (B) has the form of a double zigzag (W)-(X)-(Y). It is assumed that the market recently ended the decline in momentum (C), completing wave W, after which we saw a market reversal. Most likely, the initial part of the bundle X wave is currently being formed. This wave can take the form of a double zigzag (W)-(X)-(Y), as shown in the graph.
The price in the final active wave (Y) may rise to the level of 43565.00, which was marked by the correction (4).
Trading recommendations: Buy 36820.50, Take profit: 43565.00.
 English
 Русский
 Bahasa Indonesia
 Bahasa Malay
 ไทย
ไทย Español
 Deutsch
 Български
 Français
 Tiếng Việt
 中文
中文 বাংলা
বাংলা हिन्दी
 Čeština
 Українська
 Română

