As everyone is well aware, at the auction on January 24-28, the US dollar strengthened against all its main competitors. This was no exception for the Australian dollar, which also came under selling pressure. According to the topic of the article, today's review of AUD/USD will be technical. Taking advantage of today's opening of a new trading five-day period, we will begin the debriefing with a weekly timeframe.
Weekly

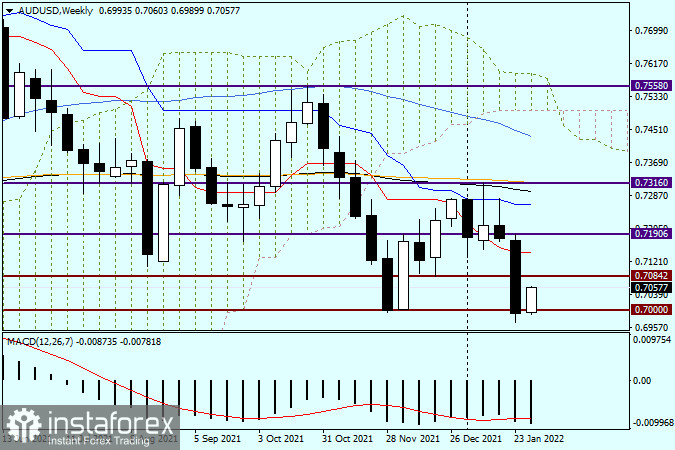
The weekly chart clearly shows that as a result of a strong downward trend, trading on January 24-28 closed slightly below the 0.7000 support level. Let me remind you that this is a significant historical, psychological, and technical mark for this currency pair. Most often it happens that even in times of strong trends, this level is not easy to pass the first attempt. As a rule, the quote returns to it or circles around 0.7000 for some time. The beginning of the current trading fully confirms this interpretation. As you can see, at the moment of writing the article, the bulls on the "Aussie" are trying to return the rate above 0.7000, and they are still succeeding. However, the week has just begun, and there are still so many important events ahead that the pair may repeatedly return above and fall below this round level. The main fundamental events for AUD/USD this week will be the announcement by the Reserve Bank of Australia (RBA) of its decision on the interest rate, as well as data on the US labor market, which will summarize the results of trading this week.
As for the technical picture, the bears on the "Aussie" need to continue the pressure and gain a foothold under the most important level of 0.7000. If they can fulfill this condition, the pair may face a further decline, and much more intense. In the event of a weekly bullish reversal candle with a closing price well above 0.7000, doubts will arise about the further ability of the bears to move the course down. For bulls on AUD/USD, the primary task is to return the rate above the red line of the Tenkan Ichimoku indicator, which runs at 0.7143.
Daily

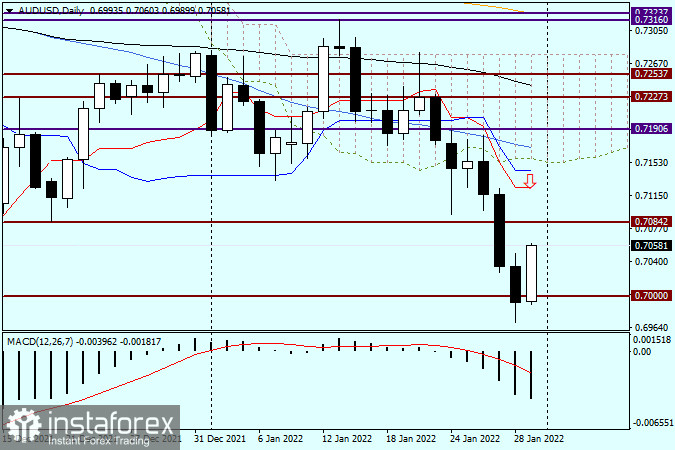
Despite Friday's closing of trading below the landmark level of 0.7000, today the pair is showing active growth, which at this point is still correctional. In order not to take up your time, I will formulate my trading recommendations, and whether to listen to them or not is a personal matter for each AUD/USD bidder. In principle, there is only one recommendation - it is selling the pair after a rise in the price area of 0.7124-0.7143. It is here that the red Tenkan line and the blue Kijun line of the Ichimoku indicator are located. I assume that in the event of a rise in the designated price zone, the pair will face strong resistance from sellers and will turn back in the south direction. In the current situation, such a trading recommendation seems to be the main one. How and what will happen will show the course of trading.
 English
 Русский
 Bahasa Indonesia
 Bahasa Malay
 ไทย
ไทย Español
 Deutsch
 Български
 Français
 Tiếng Việt
 中文
中文 বাংলা
বাংলা हिन्दी
 Čeština
 Українська
 Română

