Technical Market Outlook:
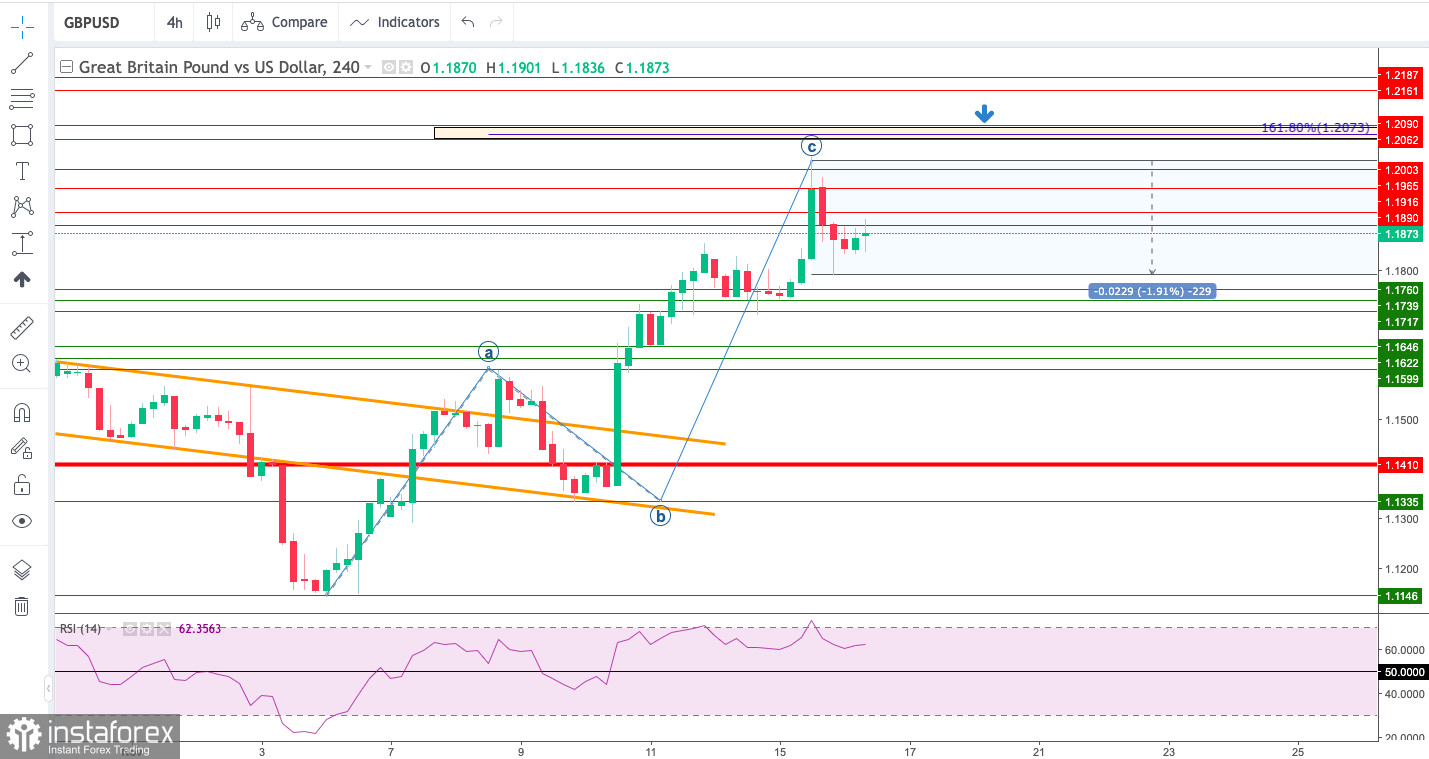
The GBP/USD pair has been seen moving higher towards the next target for bulls which is located at 161% Fibonacci extension level at 1.2073. So far the local high was made at the level of 1.2026 and then a 2% pull-back followed. The intraday technical support is seen at 1.1760, 1.1734 and 1.1722. The strong and positive momentum on the H4 time frame chart supports the bullish outlook for GBP despite the extremely overbought market conditions, however please stay focused and viligant as the pull-back lower might come any time now as the market looks overstretched o n H4 time frame chart.

Weekly Pivot Points:
WR3 - 1.19243
WR2 - 1.18500
WR1 - 1.18089
Weekly Pivot - 1.17757
WS1 - 1.17346
WS2 - 1.17014
WS3 - 1.16271
Trading Outlook:
The Bearish Engulfing candlestick pattern that was made on the weekly time frame chart has been invalidated and the strong green weekly candle was made. The bulls are temporary in control of the market and the 38% Fibonacci retracement of the last wave down located at 1.1830 had been tested as well. On the other hand, the level of 1.0351 has not been tested since 1985, so the down trend is strong. In order to terminate the down trend, bulls need to break above the level of 1.2275 (swing high from August 10th).
 English
 Русский
 Bahasa Indonesia
 Bahasa Malay
 ไทย
ไทย Español
 Deutsch
 Български
 Français
 Tiếng Việt
 中文
中文 বাংলা
বাংলা हिन्दी
 Čeština
 Українська
 Română

