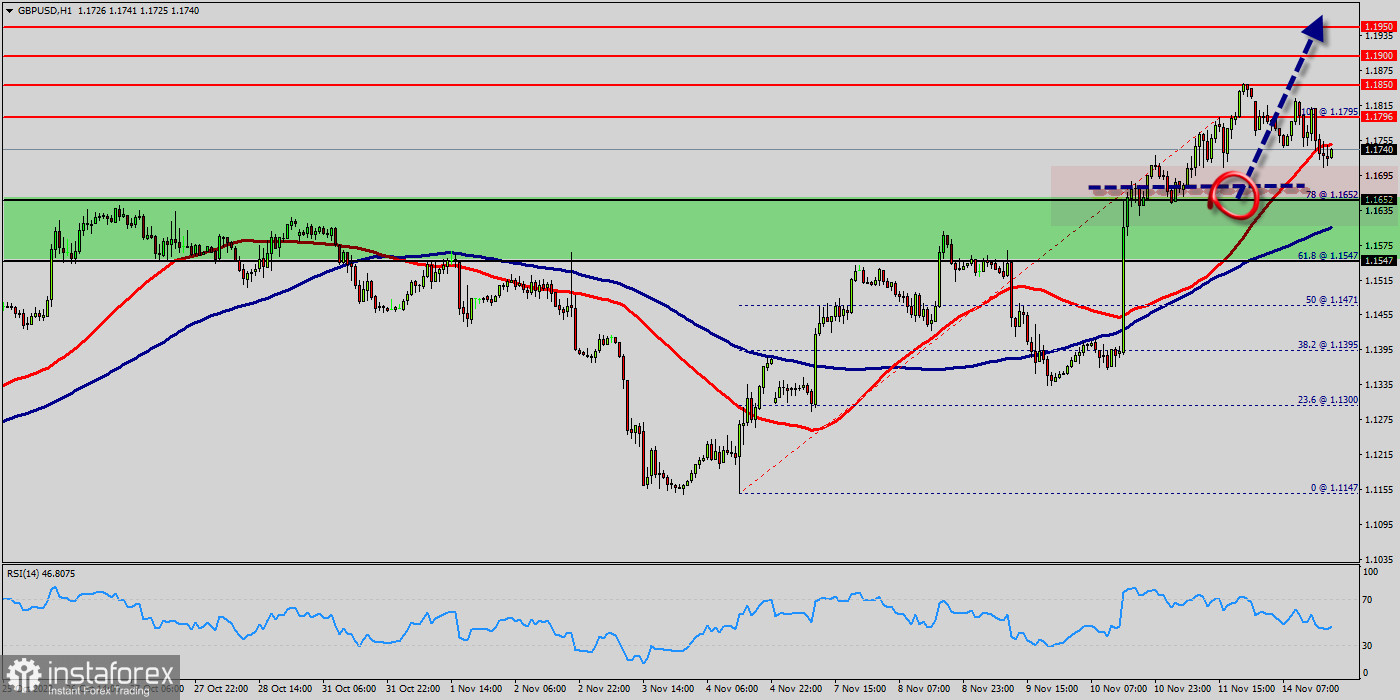
Review :
Pivot : 1.1547. The GBP/USD pair is trading sharply higher against the U.S. Dollar at the mid-session on the heels of the last month jobs report that missed expectations. The single currency soared, and the greenback weakened after the U.S. Labor Department said non-farm payrolls rose by 1.1200 last month, well short of the 1.1552 estimate. Moving averages continue to give a very strong buy signal with all of the 50 and 100 EMAs successively above slower lines and below the price. The 50 SMA has extended further above the 100 this week. Support from MAs comes initially from the value area between the 50 and 100 EMAs. The GBP/USD pair rose to 1.1421 at the start of Nov. 2022 before taking another leg higher to 1.1552. The pair briefly breached parity today, as markets reacted to US inflation figures. That was followed by an immediate rebound that sent the GBP/USD pair back above the 1.1421 level.
An alternative scenario is fixing above MA 100 H1 (1.1421), followed by growth to 1.1552 (high of the American session). The GBP/USD pair broke resistance which turned to strong support at the level of 1.1421 yesterday. The level of 1.1421 coincides with a golden ratio (61.8% of Fibonacci), which is expected to act as major support today. The Relative Strength Index (RSI) is considered overbought because it is above 50. The RSI is still signaling that the trend is upward as it is still strong above the moving average (100). Additionally, the RSI is still signaling that the trend is upward as it remains strong above the moving average (100). For now, outlook will stay bullish as long as 1.13033 resistance turned support holds, even in case of another drop. This suggests the pair will probably go up in coming hours. Accordingly, the market is likely to show signs of a bullish trend. This suggests the pair will probably go up in coming hours. Accordingly, the market is likely to show signs of a bullish trend. Buy orders are recommended above the golden ratio 1.1421 with the first target at the level of 1.1552.
Furthermore, if the trend is able to breakout through the first resistance level of 1.1644. We should see the pair climbing towards the double top (1.1644) to test it. The pair will move upwards continuing the development of the bullish trend to the level 1.1600. It might be noted that the level of 1.1644 is a good place to take profit because it will form a new double top in coming hours. The level of 1.1644 is a good target to take profits. Moreover, the RSI is still signaling that the trend is upward as it remains strong above the moving average (100). However, beware of bullish excesses that could lead to a possible short-term correction; but this possible correction would not be tradeable. On the other hand, in case a reversal takes place and the GBP/USD pair breaks through the support level of 1.1421, a further decline to 1.1352 and 1.1282 can occur. It would indicate a bearish market.
Trading recommendations :
The trend is still bullish as long as the price of 1.1510 is not broken. Thereupon, it would be wise to buy above the price of at 1.1510 with the primary target at 1.1637. Then, the GBP/USD pair will continue towards the second target at 1.1700 (a new target is around 1.1750). In technical analysis: history usually repeats itself at certain level. So it will be of the wisdom to use historic rates to determine future prices. The technical analysis based only on the technical market data (quotes) with the help of various technical indicators. Moreover, in this book we will be touching on a variety of new techniques for applying numerical strategies, equations, formulas and probabilities. Additionally, we will be sharing some of classical analysis such as breakout strategy and trend indicators.
Down trend outlook :
There is a possibility that the GBP/USD pair will move downside. The structure of a fall does not look corrective. In order to indicate a bearish opportunity below 1.1454, sell below 1.1454 or/and 1.1400 with the first target at 1.1303. Furthermore, the price has been set below the strong resistance at the level of 1.1337, which coincides with the 38.2% Fibonacci retracement level. This resistance has been rejected several times confirming the downtrend. Additionally, the RSI starts signaling a downward trend. Besides, the daily support 1 is seen at the level of 1.1400. If the pair fails to pass through the level of 1.1400, the market will indicate a bearish opportunity below the level of 1.1303. So, the market will decline further to 1.1264 in order to test the daily support 2. Market analysis > Technical analysis : Today, the first support level is seen at 1.1337, and the price is moving in a bearish channel now. As a result, if the GBP/USD pair is able to break out the first support at 1.1337, the market will decline further to 1.1200 in order to test the daily support 3. However, traders should watch for any sign of a bullish rejection that occurs around 1.1337. The level of 1.1337 coincides with 38.2% of Fibonacci, which is expected to act as a major resistance today. Since the trend is below the 38.2% Fibonacci level, the market is still in a downtrend. Overall, we still prefer the bearish scenario.
Conclusion :
Probably, the trend is consolidation above the MA 100 H1 level, followed by a rise to the targets' range 1.1567- 1.1750. The main scenario is continued decline towards 1.1500.
 English
 Русский
 Bahasa Indonesia
 Bahasa Malay
 ไทย
ไทย Español
 Deutsch
 Български
 Français
 Tiếng Việt
 中文
中文 বাংলা
বাংলা हिन्दी
 Čeština
 Українська
 Română

