Markets are looking ahead for the most important events this week: the report on US GDP and the meeting of the US Federal Reserve which begins today. In the meantime, the US dollar continues to appreciate again the British pound. Although the rate hike by the BoE is a weighty reason for growth, it cannot fuel the rally of GBP forever. Moreover, it is not clear yet what steps the UK regulator is going to take next. Was the rate hike a one-time event or a process that has just started? By contrast, the Fed is rather straightforward about its plans. The US regulator is expected to raise the rate two times this year. If tomorrow Fed Chair Jerome Powell announces or even hints at the possibility that the rate may be raised three times this year, the US dollar will get additional support and great prospects for growth against its rivals. So, let us wait for Wednesday evening to get the official announcement from the Fed. If its rhetoric turns out to be more dovish, the greenback may face a sell-off wave. Let's look at the current GBP/USD charts.
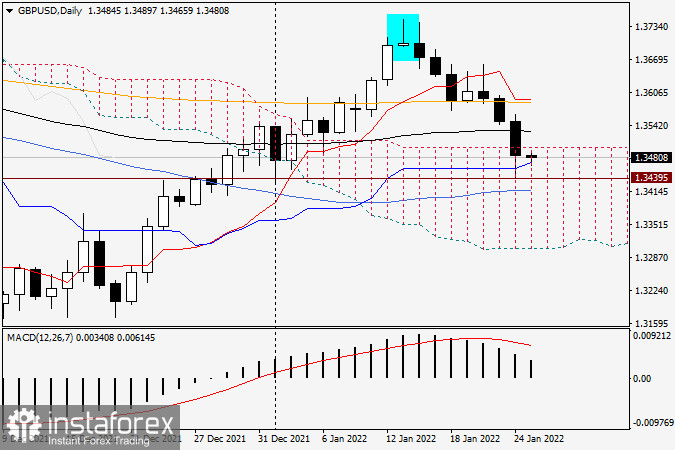
Daily chart

As can be clearly seen on the daily chart, the formation of the Gravestone candlestick pattern was followed by a trend reversal. The Gravestone doji is considered one of the strongest reversal patterns, especially when it occurs at the very end or at the peak of an uptrend. This is exactly what happened here. Yesterday, the pound/dollar pair closed the session with a decline and entered the daily Ichimoku Cloud. However, the blue Kijun line located below the upper boundary of the cloud served as strong support for the price. After a rebound, the candlestick formed a long lower shadow with the support level at 1.3440. In my opinion, this long shadow from yesterday creates a good opportunity for the pair to return above the upper line of the Ichimoku indicator today. If this scenario is true, settling within the indicator lines can be considered a false signal, which will favor the pound bulls. Resistance is represented by the 89-period exponential moving average located at 1.3530. In addition to 1.3440, the pair found support at 1.3417 where the 50-day simple moving average lies.
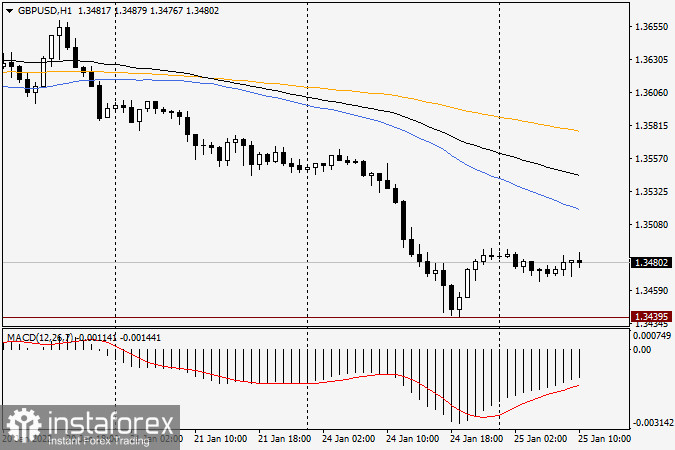
H1 chart

Given the reversal movement on the daily chart and the fact that the price is holding below all three moving averages and the key level of 1.3500 on H1, I recommend selling the GBP/USD pair after a short rise to 1.3500, 1.3525, 1.3545, or 1.3577. However, the market is unlikely to develop such a movement and reach the level of 1.3577 ahead of the Fed's meeting. Long positions are less advisable now but can be considered near the current level of 1.3480.
Good luck!
 English
 Русский
 Bahasa Indonesia
 Bahasa Malay
 ไทย
ไทย Español
 Deutsch
 Български
 Français
 Tiếng Việt
 中文
中文 বাংলা
বাংলা हिन्दी
 Čeština
 Українська
 Română

