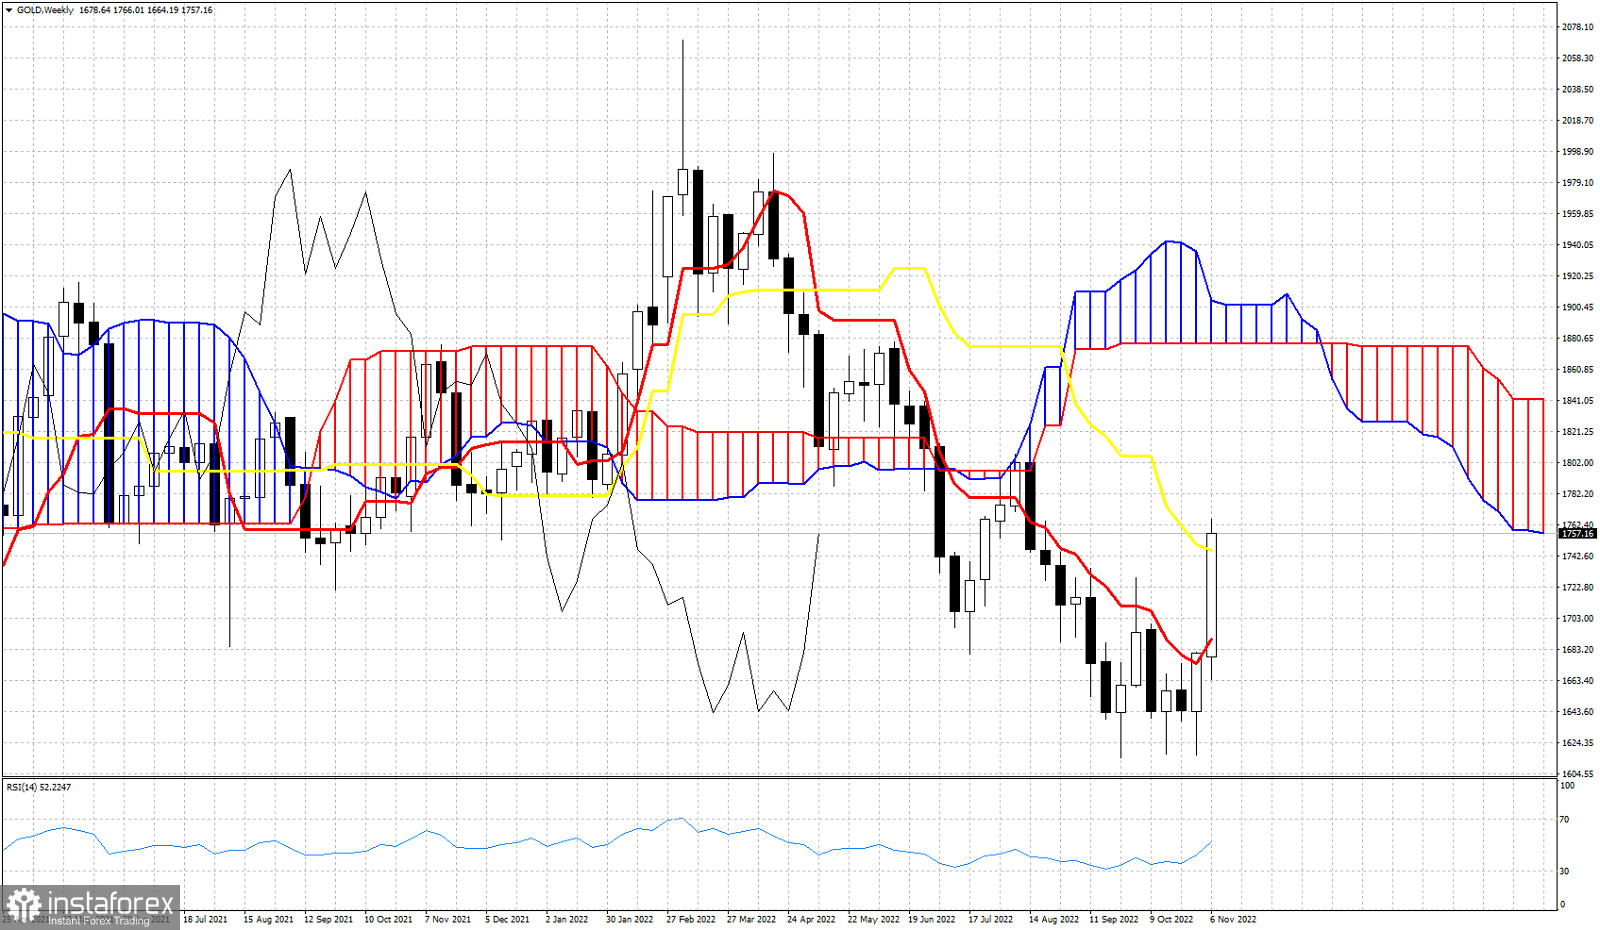
Gold's weekly chart is promising despite trading below the weekly Kumo. On a daily basis we have a strong bullish signal as price is breaking above the Daily Kumo (cloud). In the weekly chart we see Gold price pushing above the kijun-sen (yellow line indicator). The tenkan-sen (red line indicator) is also turning upwards and price has the momentum to reach the Kumo lower boundary at $1,877. A second consecutive strong week for bulls and there is potential for a third and price to break above $1,800. Short-term support is at $1,710 where previous resistance was. Bulls do not want to see price break back below this level.
 English
 Русский
 Bahasa Indonesia
 Bahasa Malay
 ไทย
ไทย Español
 Deutsch
 Български
 Français
 Tiếng Việt
 中文
中文 বাংলা
বাংলা हिन्दी
 Čeština
 Українська
 Română

