Technical Market Outlook:
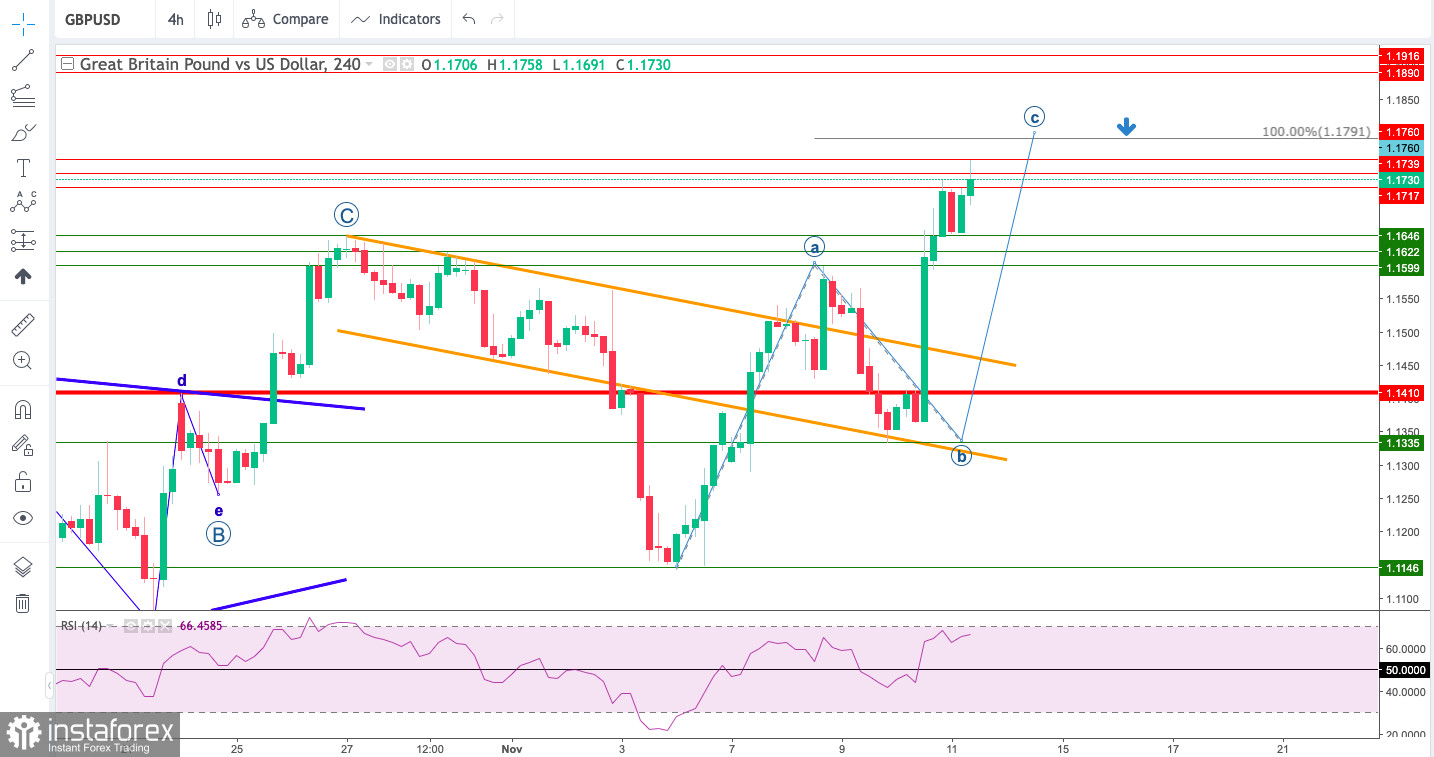
The GBP/USD pair has made a new local high at the level of 1.1758, which is way above the H4 time frame channel. Currently, the market is again trading above the wave A high as well, so the corrective cycle is getting more complex and time consuming. The cycle high for now is seen at 100% Fibonacci extension of the wave A located at 1.1791. The intraday technical support is seen at 1.1646, 1.1622 and 1.1600. The strong and positive momentum on the H4 time frame chart supports the bullish outlook for GBP.

Weekly Pivot Points:
WR3 - 1.14110
WR2 - 1.13668
WR1 - 1.13400
Weekly Pivot - 1.13226
WS1 - 1.12958
WS2 - 1.12784
WS3 - 1.12342
Trading Outlook:
Despite the recent upward ABC correction towards the level of 1.1625, the Bearish Engulfing candlestick pattern was made at the top of the bounce and the bears are still in charge of the market. The next long-term target for them is the parity level. The level of 1.0351 has not been tested since 1985, so the down trend is strong, however, the market is extremely oversold on longer time frames already. In order to terminate the down trend, bulls need to break above the level of 1.2275 (swing high from August 10th).
 English
 Русский
 Bahasa Indonesia
 Bahasa Malay
 ไทย
ไทย Español
 Deutsch
 Български
 Français
 Tiếng Việt
 中文
中文 বাংলা
বাংলা हिन्दी
 Čeština
 Українська
 Română

