The yen paired with the dollar continues its downward path. The USD/JPY pair in early January updated the five-year price maximum, reaching 116.36, but then turned around and began to slide down systematically. In two and a half weeks, the price has decreased by almost 300 points, despite the fairly strong positions of dollar bulls.
In many pairs of the "major" group, the greenback is more resolutely on the defensive, while waiting for the results of the January Fed meeting. However, when paired with the yen, the dollar is consistently getting cheaper.
At the same time, the Japanese currency ignores "its" fundamental factors. For example, the "dovish" remarks of the head of the Bank of Japan were ignored by traders. All this suggests that the Japanese currency is now in high demand as a protective asset. This is an important point that speaks volumes. In particular, the fact that the USD/JPY's downward trend depends on external circumstances, which are mostly caused by market nervousness on the eve of the January meeting of the Federal Reserve.

However, Friday's release of data on inflation growth in Japan still supported the yen. Thanks to a combination of fundamental factors, sellers of USD/JPY were able to test the support level of 113.60 (the lower line of the Bollinger Bands indicator) during the Asian session on Friday. The last time the pair was in this price area was a month ago - on the 20th of December.
Still, it is too early to talk about a trend reversal: many factors speak in favor of further growth of USD/JPY in the medium term, at least in the context of testing the borders of the 115th figure. Japanese inflation in this case will not save the yen, especially since Friday's release also has its flaws.
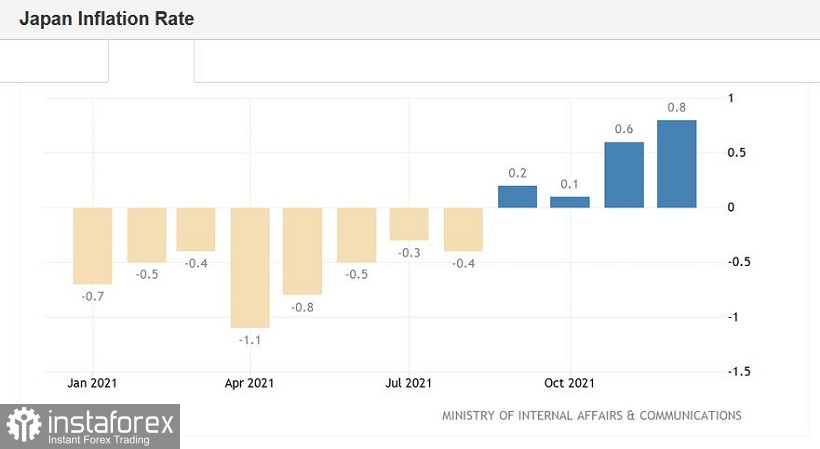
On the one hand, the data surprised with its "capital" indicator. The overall consumer price index in December not only went into the "green zone", exceeding the forecast values, but also updated a two-year high: the last time the indicator was at this level was in January 2020. It can also be noted here that from November 2020 to October 2021, the overall CPI was in the negative area, and only at the end of last year began to "show signs of life". And Friday's breakthrough would really surprise if not for one "but" - the rest of the components of the release showed either weak or negative dynamics.
Thus, the consumer price index excluding food prices came out at around 0.5% after a similar increase in November. But the inflation index, excluding food and energy prices, was again in the "red zone", dropping to -0.7% (the forecast was at -0.4%). Considering the global energy crisis, which was felt back in October last year, one can come to a rather obvious conclusion that the growth of the "headline" indicator of Japanese inflation was due to temporary factors.
For example, it is known that Japanese electricity producers in November last year - for the first time in 8 years - decided to raise prices. In December, electricity bills for Japanese consumers rose by 13.4% year-on-year. This is the fastest growth rate in the last 40 years. Gasoline prices, in turn, jumped 22.4%.
The temporary nature of inflation growth, as well as weak wage growth, will not allow the Bank of Japan to follow the example of its counterparts from the U.K., New Zealand, or the U.S. This was announced on Friday by Bank of Japan Governor Haruhiko Kuroda. He noted that "unlike the central banks of the United States and the European Union, the Central Bank of Japan should continue our extremely accommodative, easy monetary policy for the time being."
According to most experts, the Japanese regulator will remain one of the most dovish central banks for the foreseeable future. The Japanese Central Bank will not tighten measures and will maintain large-scale incentives. According to some analysts, the Bank of Japan will remain "on standby" until at least the spring of 2023 (in April this year, Haruhiko Kuroda should leave the position of the head of the Bank of Japan).


Actually, this is evidenced by the results of the last - January - meeting of the Central Bank of Japan (the results were announced this Tuesday). Members of the Governing Council maintained a cautious and wait-and-see attitude, assuring market participants that they would implement an ultra-soft policy. The regulator maintained a highly cautious recovery outlook, while stressing that the risks to the economy are now "tilted to the downside" due to the impact of Omicron.
In other words, the yen did not have, and still does not have, its own arguments for strengthening. The Japanese currency is in high demand only due to the flight from risks. On the eve of the January Fed meeting, nervousness is growing in the markets. Traders presented too "large an account" to the representatives of the Federal Reserve. Whether they will be able to "pay for it" (by announcing three or four rate increases, the first of which should happen in March) is an open question. And the closer the "X hour" is, the more the spring is compressed.
If the hawkish expectations come true, this spring will release even faster – the USD/JPY pair will shoot up. That is, the current strengthening of the yen is still a kind of "house of cards" than a steady downward trend. However, if we talk about the prospect of the next few days, the advantage is still on the side of the Japanese currency.
Given such an ambiguous fundamental background, it is best to take a wait-and-see position for the pair, although bearish sentiment is likely to prevail until the announcement of the results of the January Fed meeting, that is, until January 26th. The support level is 113.00, which is the lower boundary of the Kumo cloud on the daily chart, and the middle line of the Bollinger Bands indicator on the weekly timeframe.
 English
 Русский
 Bahasa Indonesia
 Bahasa Malay
 ไทย
ไทย Español
 Deutsch
 Български
 Français
 Tiếng Việt
 中文
中文 বাংলা
বাংলা हिन्दी
 Čeština
 Українська
 Română

