To open long positions on EURUSD, you need:
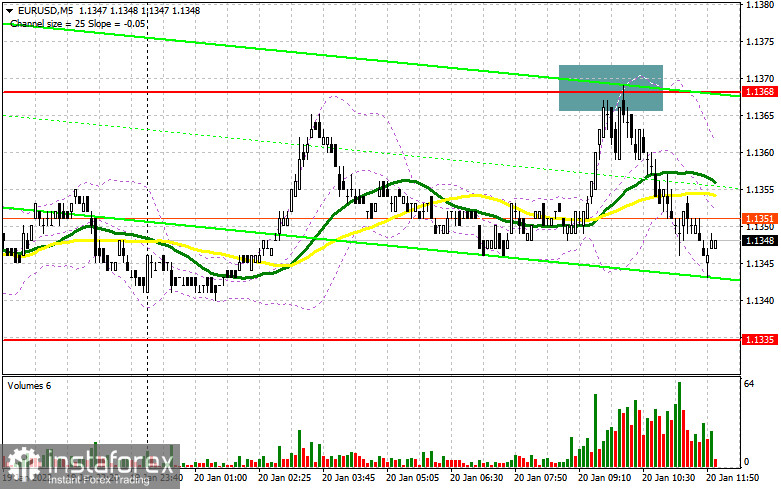
In my morning forecast, I paid attention to the level of 1.1368 and recommended making decisions on entering the market. Let's look at the 5-minute chart and figure out what happened. The data on inflation in the eurozone fully coincided with economists' forecasts, but the report on the growth rate of production prices in Germany surprised - a jump of 5.0% at once compared with the forecast of 0.8%. Against this background, euro buyers attempted to rise above the resistance of 1.1368, but it was unsuccessful. The formation of a false breakdown at this level formed a sell signal. At the time of writing, the pair has already gone down more than 20 points and the pressure on the euro is only increasing. From a technical point of view, everything remained unchanged. And what were the entry points for the pound this morning?

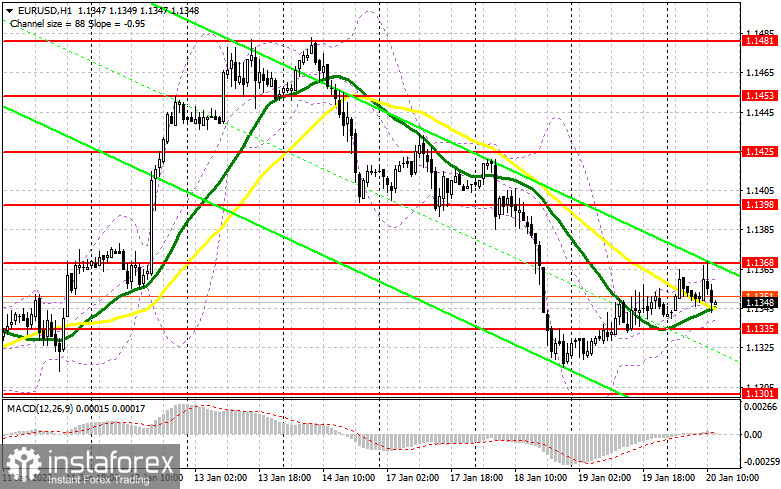
In the afternoon, several reports on the US economy are coming out, which may support the US dollar or at least become a catalyst for a larger sell-off of the pair. The primary task of buyers remains to protect the support of 1.1335, formed by the results of yesterday. The formation of a false breakdown at this level, together with weak data on the Fed-Philadelphia manufacturing index and the number of initial applications for unemployment benefits, will lead to a signal to buy the euro. However, the risk of a tougher position of the Federal Reserve in relation to monetary policy will restrain the appetite for the euro. The breakdown of 1.1368 remains an equally important task for buyers, which could not be done in the first half of the day. Only a reverse test of this level from above will lead to an additional buy signal and open up the possibility of a new jump to the area: 1.1398 and 1.1425, where I recommend fixing the profits. A more distant target will be the 1.1453 area. With the pair declining during the American session and the lack of bull activity at 1.1335, it is best to postpone purchases until the base of the 13th figure. However, I advise you to open long positions there when forming a false breakdown. From the level of 1.1265, you can buy EUR/USD immediately for a rebound with the aim of an upward correction of 20-25 points within a day.
To open short positions on EURUSD, you need:
Sellers coped with the task perfectly and managed to protect the resistance of 1.1368, forming a good entry point into short positions from there. Until the moment when trading is conducted below this range, we can count on a further fall in the euro. In the case of EUR/USD growth in the afternoon, only another false breakdown formation at this level, together with strong data on the real estate market and the US labor market, will bring sellers back, which forms another entry point into short positions. The target will be the nearest support level of 1.1335. A breakdown and test of this range from the bottom up will give an additional signal to open short positions already with the prospect of falling to a large minimum of 1.1301. A more distant target will be the 1.1265 area, where I recommend fixing the profits. In the event of a rise in the euro and the absence of bear activity at 1.1368, and it may be so if this level is retested, it is best not to rush with sales. The optimal scenario will be short positions when forming a false breakdown in the area of 1.1397, from which the main fall of the euro occurred on Tuesday. You can sell EUR/USD immediately for a rebound from 1.1425, or even higher - around 1.1453 with the aim of a downward correction of 15-20 points.

The COT report (Commitment of Traders) for January 11 recorded an increase in long positions and a reduction in short ones, which led to a change in the negative value of the delta to a positive one. The market is gradually changing and the demand for the European currency, despite the expected changes in the policy of the Federal Reserve System, has not gone away. The US inflation data released last week did not make any impression on traders, as the result almost completely coincided with economists' expectations. Against this background, Federal Reserve Chairman Jerome Powell spoke quite calmly about future interest rates at a time when many traders expected a more aggressive policy from the central bank. Currently, three increases are projected this year and the first of them will occur in March this year. The sharp decline in retail trade in the United States in December of this year also allows the Fed not to force events. Meanwhile, the European Central Bank plans to fully complete its emergency bond purchase program in March this year. However, the regulator is not going to take any other actions aimed at tightening its policy, which limits the upward potential of risky assets. The COT report indicates that long non-profit positions rose from the level of 199,073 to the level of 204,361, while short non-profit positions fell from the level of 200,627 to the level of 198,356. This suggests that traders will continue to increase long positions on the euro to build an upward trend for the pair. At the end of the week, the total non-commercial net position became positive and amounted to 6005 against -1554. The weekly closing price rose slightly to 1.1330 against 1.1302 a week earlier.
Signals of indicators:
Moving averages
Trading is conducted around 30 and 50 daily moving averages, which indicates the lateral nature of the market in the short term.
Note: The period and prices of moving averages are considered by the author on the hourly chart H1 and differ from the general definition of the classic daily moving averages on the daily chart D1.
Bollinger Bands
A breakthrough of the upper limit of the indicator in the area of 1.1355 will lead to a new wave of euro growth. A breakthrough of the lower limit of the indicator in the area of 1.1330 will increase pressure on the euro.
Description of indicators
- Moving average (moving average determines the current trend by smoothing out volatility and noise). Period 50. The graph is marked in yellow.
- Moving average (moving average determines the current trend by smoothing out volatility and noise). Period 30. The graph is marked in green.
- MACD indicator (Moving Average Convergence / Divergence - moving average convergence/divergence) Fast EMA period 12. Slow EMA period 26. SMA period 9
- Bollinger Bands (Bollinger Bands). Period 20
- Non-profit speculative traders, such as individual traders, hedge funds, and large institutions that use the futures market for speculative purposes and meet certain requirements.
- Long non-commercial positions represent the total long open position of non-commercial traders.
- Short non-commercial positions represent the total short open position of non-commercial traders.
- Total non-commercial net position is the difference between the short and long positions of non-commercial traders.
 English
 Русский
 Bahasa Indonesia
 Bahasa Malay
 ไทย
ไทย Español
 Deutsch
 Български
 Français
 Tiếng Việt
 中文
中文 বাংলা
বাংলা हिन्दी
 Čeština
 Українська
 Română

