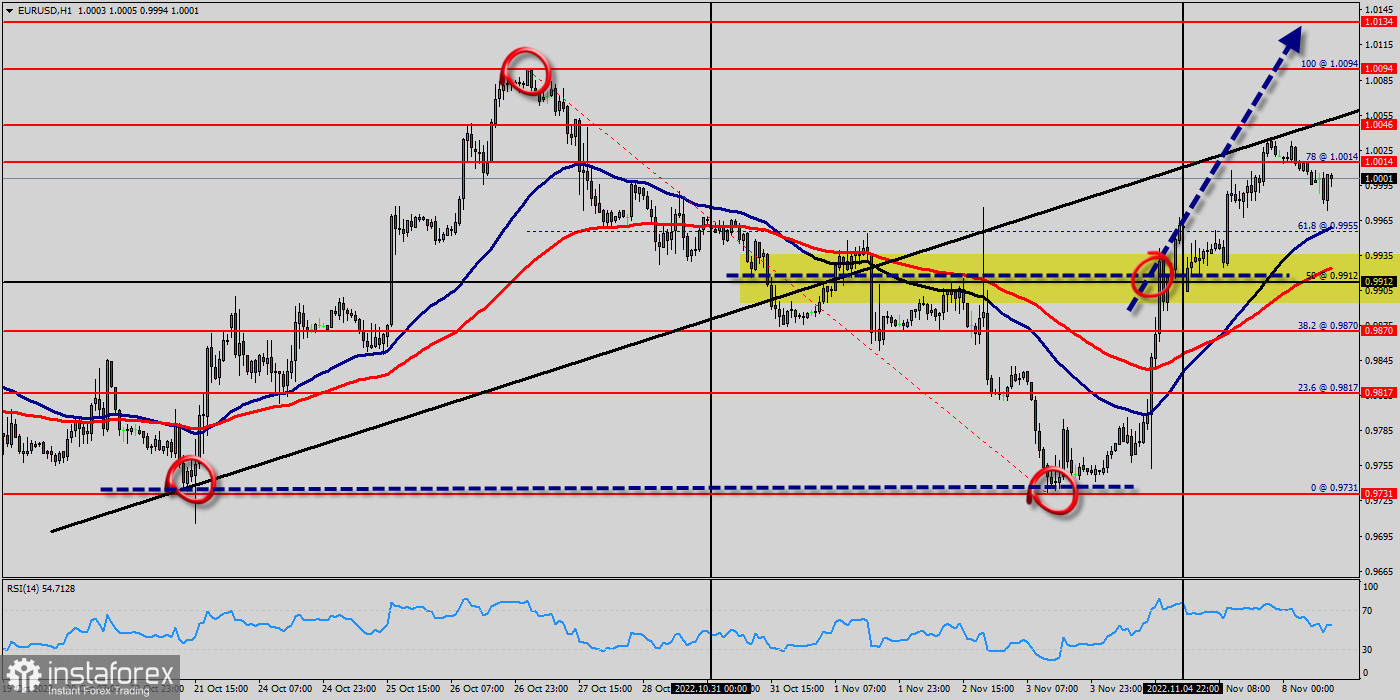
The EUR/USD pair's rise from the price of 0.9912 resumes today and accelerates to as high as 1.0030 so far. Immediate concentrate is now on 1.0046 resistance, which is close to 100-day EMA (now at 1 USD). Decisive break there argue that such rally is at least correcting the fall from 1.0030 to set at 1 USD. Also, it should be noted that U.S. inflation was 0.75% in November 2022, holding close to its highest annual rate in four decades despite easing energy costs.
The EUR/USD pair retreated from around 1.0014, the 78% of Fibonacci retracement of the daily climb measured between 1.0046 and 0.9912, so holds above the former critical resistance, now support at 0.9912. Today, the EUR/USD pair has broken resistance at the level of 0.9912 which acts as support now. Thus, the pair has already formed minor support at 0.9912. The strong support is seen at the level of 0.9870 because it represents the weekly support 1.
Technical readings in the daily chart favor a bullish continuation, as indicators maintain their firmly bullish slopes within positive levels, while the 100 MA heads firmly higher below the current level. Equally important, the RSI and the moving average (100) are still calling for an uptrend. The RSI is becoming to signal an upward trend, as the trend is still showing strong above the moving average (100) and (50). On the hourly chart, the EUR/USD pair continues to test the strength of the resistance - the moving average line MA (100) H1 (1.0014).
On the four-hour chart, the EUR/USD pair is also still above the MA 50 H4 line. Based on the above, it is probably worth sticking to the north direction in trading, and as long as the EUR/USD pair remains below MA 50 H1, it may be necessary to look for entry points to buy at the end of the correction. Therefore, the market indicates a bullish opportunity at the level of 0.9912 in the H1 chart. Also, if the trend is buoyant, then the currency pair strength will be defined as following: EUR is in an uptrend and USD is in a downtrend. Buy above the minor support of 0.9912 (this price is coinciding with the ratio of 50% Fibonacci) with the first target at 1.0046 and continue towards 1.0094 (the daily resistance 2).
On the other hand, if the price closes below the minor resistance, the best location for the stop loss order is seen below 0.9912; hence, the price will fall into the bearish market in order to go further towards the strong support at 0.9870 to test it again. On the downside, break of 0.9870 major support will suggest that such rebound has completed and bring retest of 0.9817 low instead. Furthermore, the level of 0.9731 will form a double bottom.
If the pair succeeds in passing through the level of 0.9912, the market will indicate the bearish opportunity below the level of 0.9912 in order to reach the second target at 0.9817. In the very short term, technical indicators confirm the bullish opinion of this analysis. It is appropriate to continue watching any excessive bullish movements or scanner detections which might lead to a small bearish correction (0.9731).
At the same time, if a breakout happens at the resistance levels of 1.0014 , then this scenario may be gone uptrend, because we still prefer the bullish scenario.
 English
 Русский
 Bahasa Indonesia
 Bahasa Malay
 ไทย
ไทย Español
 Deutsch
 Български
 Français
 Tiếng Việt
 中文
中文 বাংলা
বাংলা हिन्दी
 Čeština
 Українська
 Română

