 English
  Русский
 Bahasa Indonesia
 Bahasa Malay
 ไทย
ไทย Español
 Deutsch
 Български
 Français
 Tiếng Việt
 中文
中文 বাংলা
বাংলা हिन्दी
 Čeština
 Українська
 Română

Trend analysis (Fig. 1)
The price from the level of 1.3701 (closing of yesterday's daily candlestick) will make an attempt to continue its growth to the target of 1.3747 – the upper fractal (daily candle from 1/13/2022) today. After testing this level, it may start declining to the target of 1.3662 – the pullback level of 14.6% (red dotted line).
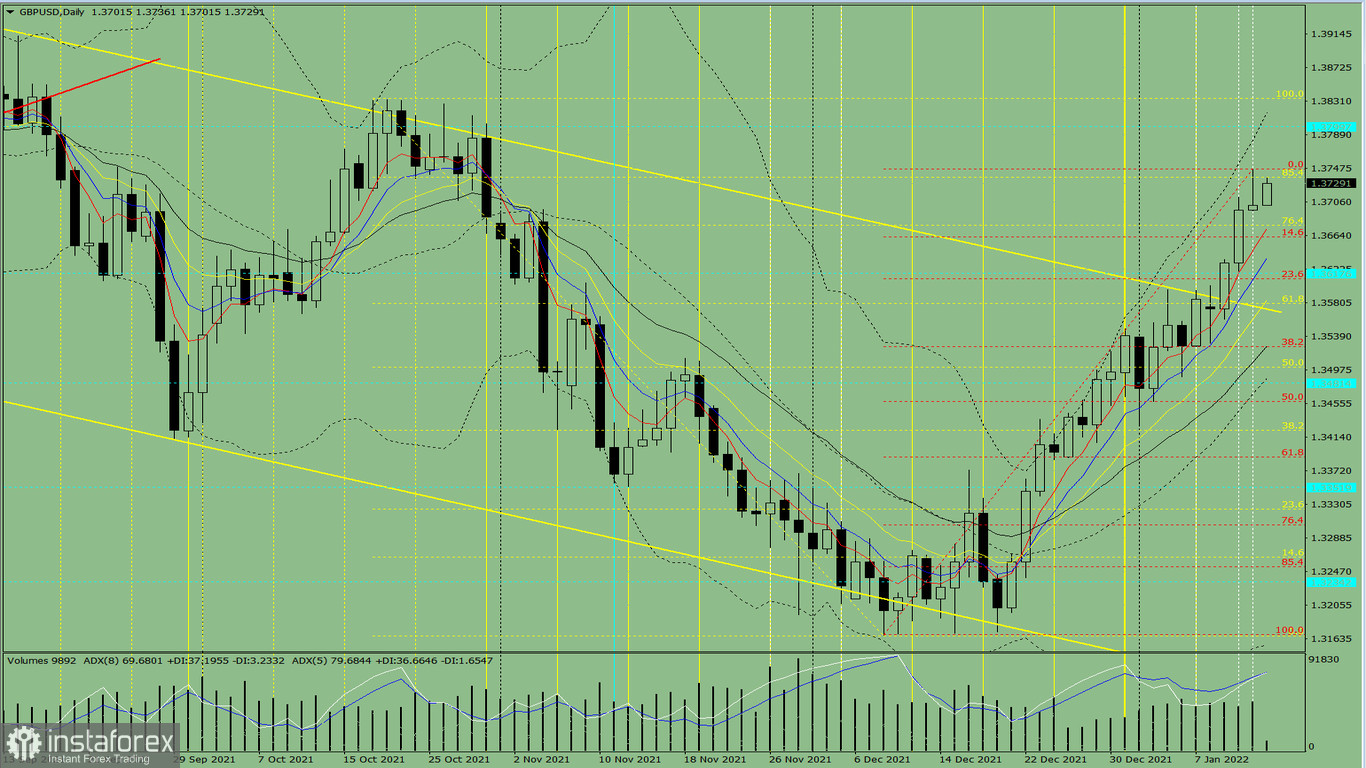
Fig 1 (daily chart)
Comprehensive analysis:
- Indicator analysis - up
- Fibonacci levels - up
- Volumes - up
- Candlestick analysis - up
- Trend analysis - up
- Bollinger lines - up
- Weekly chart - up
General conclusion:
Today, the price from the level of 1.3701 (closing of yesterday's daily candlestick) will try to further increase to the target of 1.3747 – the upper fractal (daily candle from 1/13/2022). Once this level is tested, the beginning of the decline can be expected to the target of 1.3662 – the pullback level of 14.6% (red dotted line).
Alternatively, the price from the level of 1.3701 (closing of yesterday's daily candlestick) can also attempt to move up to the target of 1.3747 – the upper fractal (daily candle from 1/13/2022) and then rise higher to the target of 1.3800 – the historical resistance level (blue dotted line) after testing it.