GBP/USD 5M

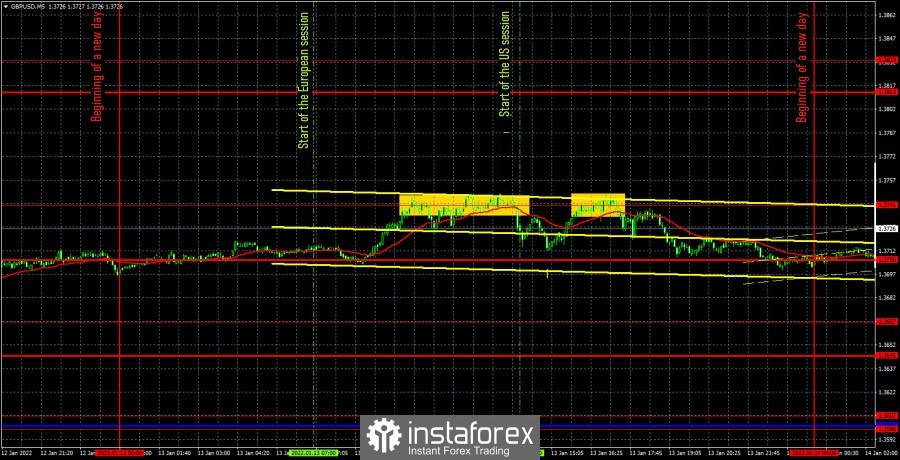
The GBP/USD pair showed movement slightly better than the EUR/USD pair on Thursday. There were only a couple of bursts of volatility during the day, which, however, did not lead to anything good. The overall volatility of the day was low. There were no macroeconomic statistics in the UK. In the United States, there are only a couple of minor publications that did not have much impact on the process (marked with the number "1" in the chart). There were few trading signals, and they took a long time to form. The first sell signal was formed for more than half of the European trading session. The price reached the extreme level of 1.3741 and bounced off it several times, so traders could open short positions on this signal. However, all the pair was able to do was go down exactly 20 points, thanks to which it was possible to set the Stop Loss to breakeven. The short position eventually closed in this order. The pair returned to the level of 1.3741 during the US session and again began a "long formation". Therefore, it was no longer necessary to work out the second sell signal, since the time was approaching evening. Accordingly, neither profit nor loss was received on Thursday. The pound as a whole remains close to its local highs, continuing to cause confusion about the reasons for its growth for such a long time.
GBP/USD 1H

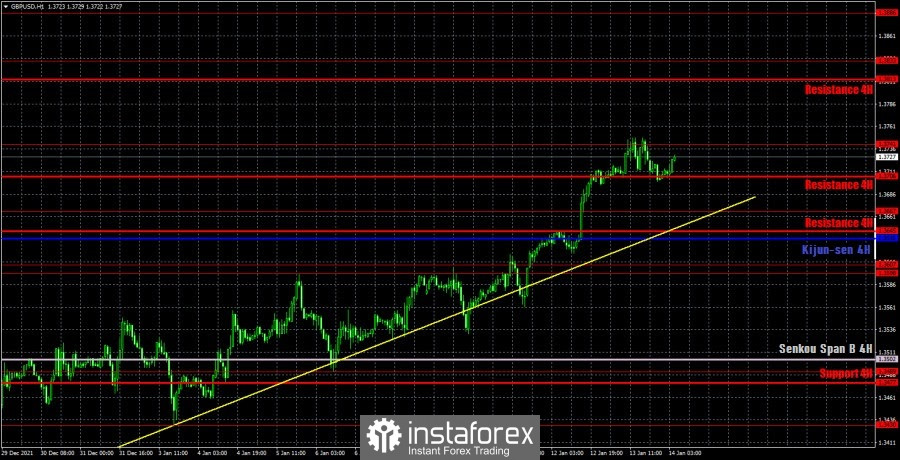
The pound/dollar pair continues its upward movement on the hourly timeframe, although it has previously settled below the ascending trend line twice. Therefore, the trend line is not relevant at this time, but we left it on the chart solely to illustrate the upward trend. Despite the fact that the movement was weak yesterday, the pair still remains in an upward trend and it has gained momentum, so it may continue for some time. Unfortunately, it is not possible to rely on the trend line at this time, since consolidating under it does not mean that the pair will start moving down. We highlight the following important levels on January 14: 1.3598-1.3607, 1.3667, 1.3741, 1.3833. The Senkou Span B (1.3502) and Kijun-sen (1.3636) lines can also be signal sources. Signals can be "bounces" and "breakthroughs" of these levels and lines. It is recommended to set the Stop Loss level to breakeven when the price passes in the right direction by 20 points. The lines of the Ichimoku indicator can move during the day, which should be taken into account when determining trading signals. Several important publications are scheduled for Friday in the UK. We recommend paying attention to the GDP report in November and the industrial production report in the same month. It is not a fact that these indicators will impress traders. It is not a fact that traders will pay attention to them at all. At the same time, they are quite important and should not be ignored. The United States will also publish a fairly important report on retail sales and a less important report on industrial production and consumer sentiment index from the University of Michigan. In general, the macroeconomic background will be of average strength today.
Explanations for the chart:
Support and Resistance Levels are the levels that serve as targets when buying or selling the pair. You can place Take Profit near these levels.
Kijun-sen and Senkou Span B lines are lines of the Ichimoku indicator transferred to the hourly timeframe from the 4-hour one.
Support and resistance areas are areas from which the price has repeatedly rebounded off.
Yellow lines are trend lines, trend channels and any other technical patterns.
Indicator 1 on the COT charts is the size of the net position of each category of traders.
Indicator 2 on the COT charts is the size of the net position for the non-commercial group.
 English
 Русский
 Bahasa Indonesia
 Bahasa Malay
 ไทย
ไทย Español
 Deutsch
 Български
 Français
 Tiếng Việt
 中文
中文 বাংলা
বাংলা हिन्दी
 Čeština
 Українська
 Română

