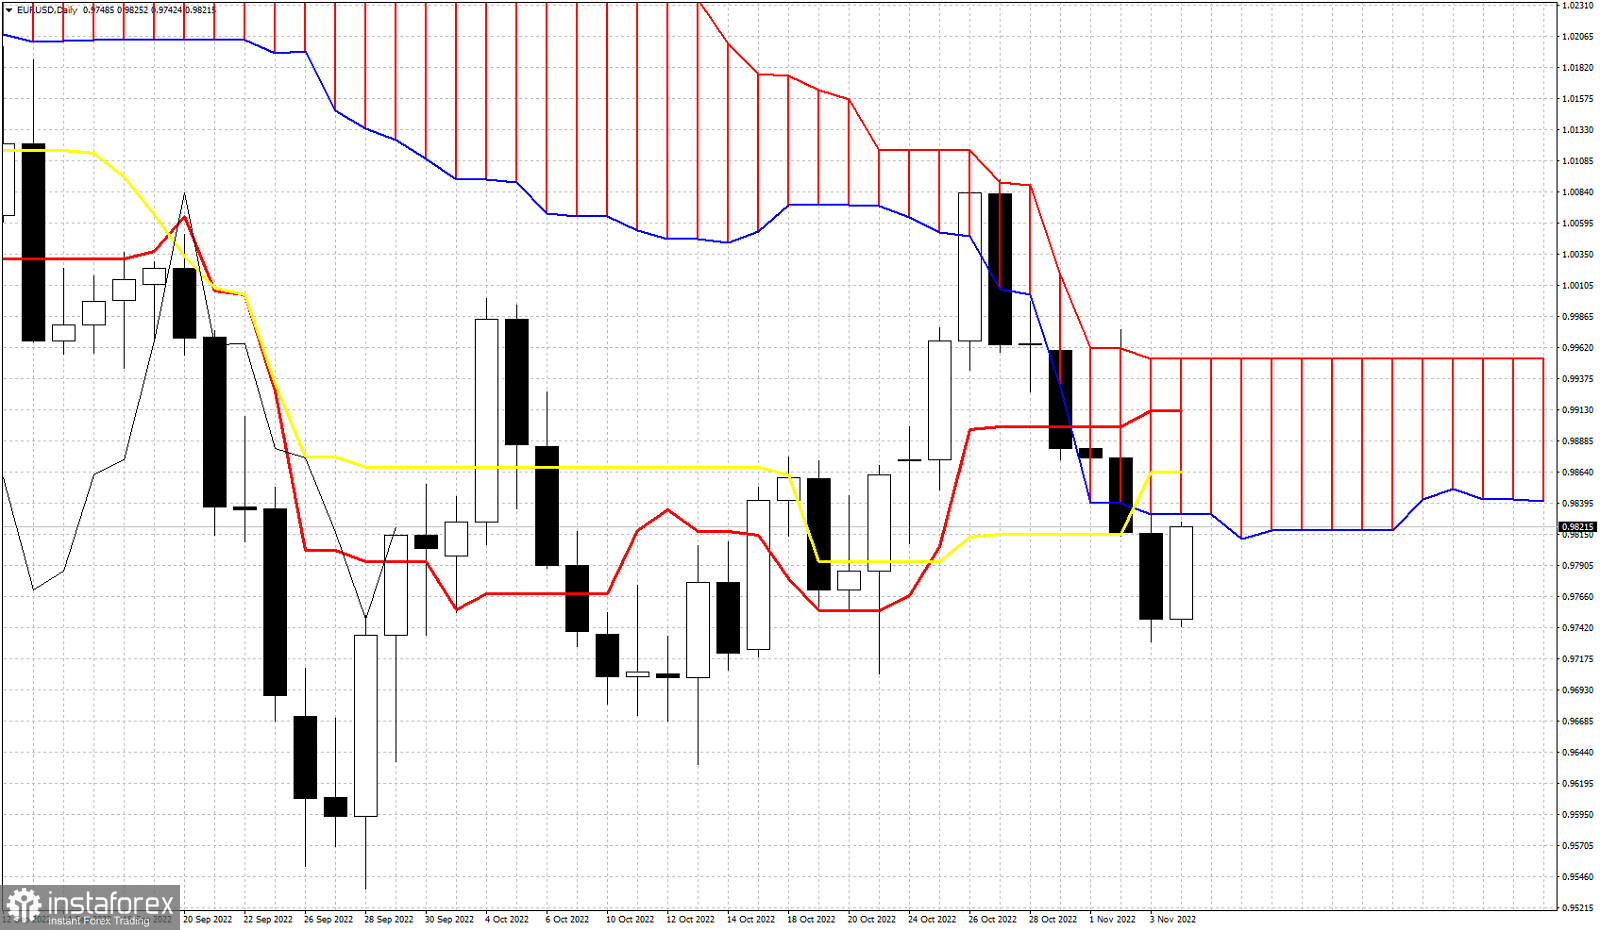
EURUSD is trading around 0.9820. Friday's are excellent days where a counter trend move usually occurs as traders prefer to realize their profits from the week ending. A down week has given bears a lot of profits and it is normal to see a bounce on Friday as bears take profits. This is also common technically speaking. After a cloud break we usually see price back testing the cloud boundaries. In this case we saw two days ago price break below the cloud and is now bouncing as a back test. Resistance by the cloud lower boundary is at 0.9830. Next resistance is at the kijun-sen (yellow line indicator) at 0.9865. If bulls manage to break above the kijun-sen, then I will expect price to test the upper cloud boundary at 0.9952. As long as price is below the Kumo (cloud) we remain bearish.
 English
 Русский
 Bahasa Indonesia
 Bahasa Malay
 ไทย
ไทย Español
 Deutsch
 Български
 Français
 Tiếng Việt
 中文
中文 বাংলা
বাংলা हिन्दी
 Čeština
 Українська
 Română

