Analyzing trades on Monday
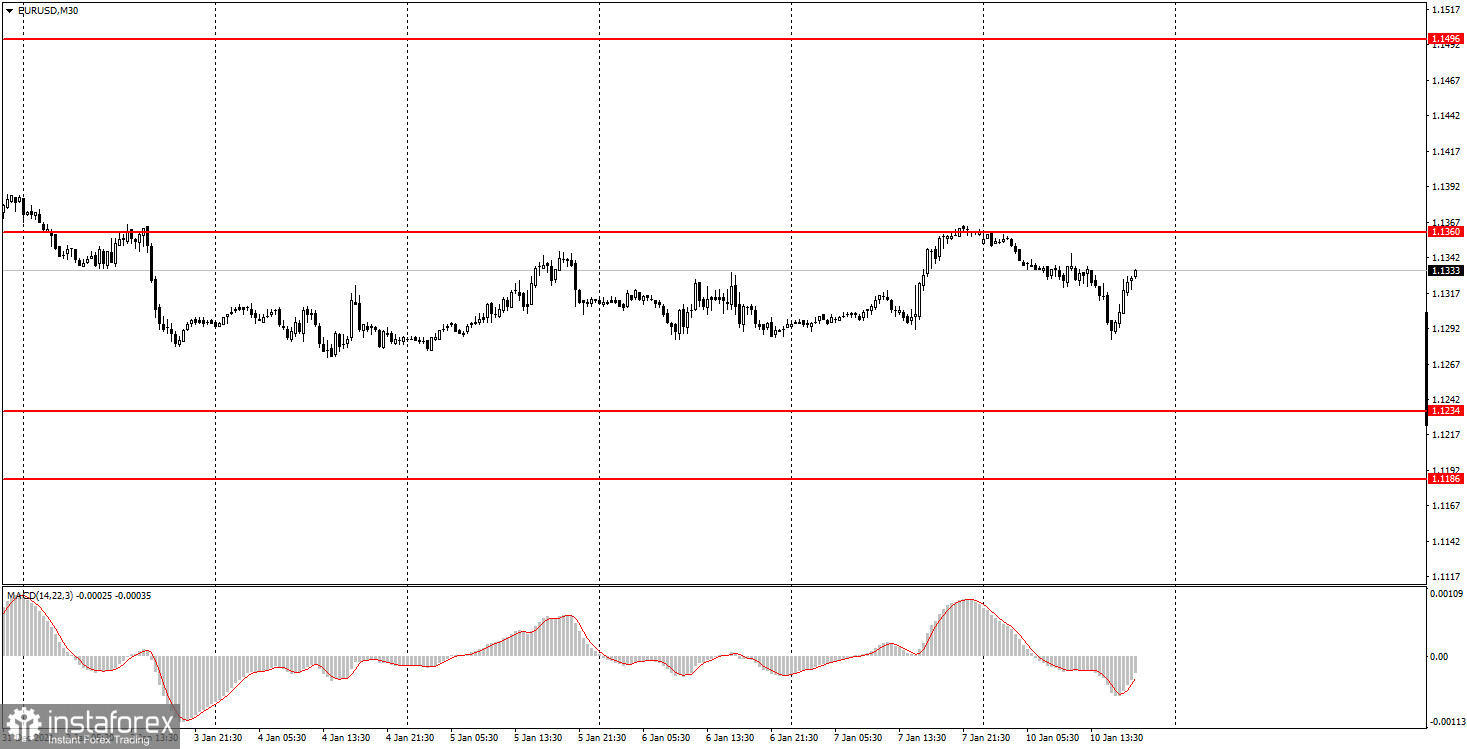
EUR/USD on 30M chart

The EUR/USD pair's trajectory was quite predictable on Monday. On Friday, the pair rose to the level of 1.1360 following a weak report on Nonfarm Payrolls in the US. That is, the dollar fell against the European currency. However, on Monday, the greenback advanced by just the same amount it lost on Friday. Notably, this time, the dollar's uptrend happened without any macroeconomic reports. Moreover, in the second half of the day, the US dollar started a new round of growth, which was also not supported by any fundamental factors. Thus, the euro/dollar pair remained inside the sideways channel of 1.1234 - 1.1260, having rebounded from its upper boundary. There were no important publications on Monday, either in the US or in the EU. Nevertheless, the volatility was quite high - more than 70 pips. Therefore, on Monday, beginners could have relied only on technical analysis.
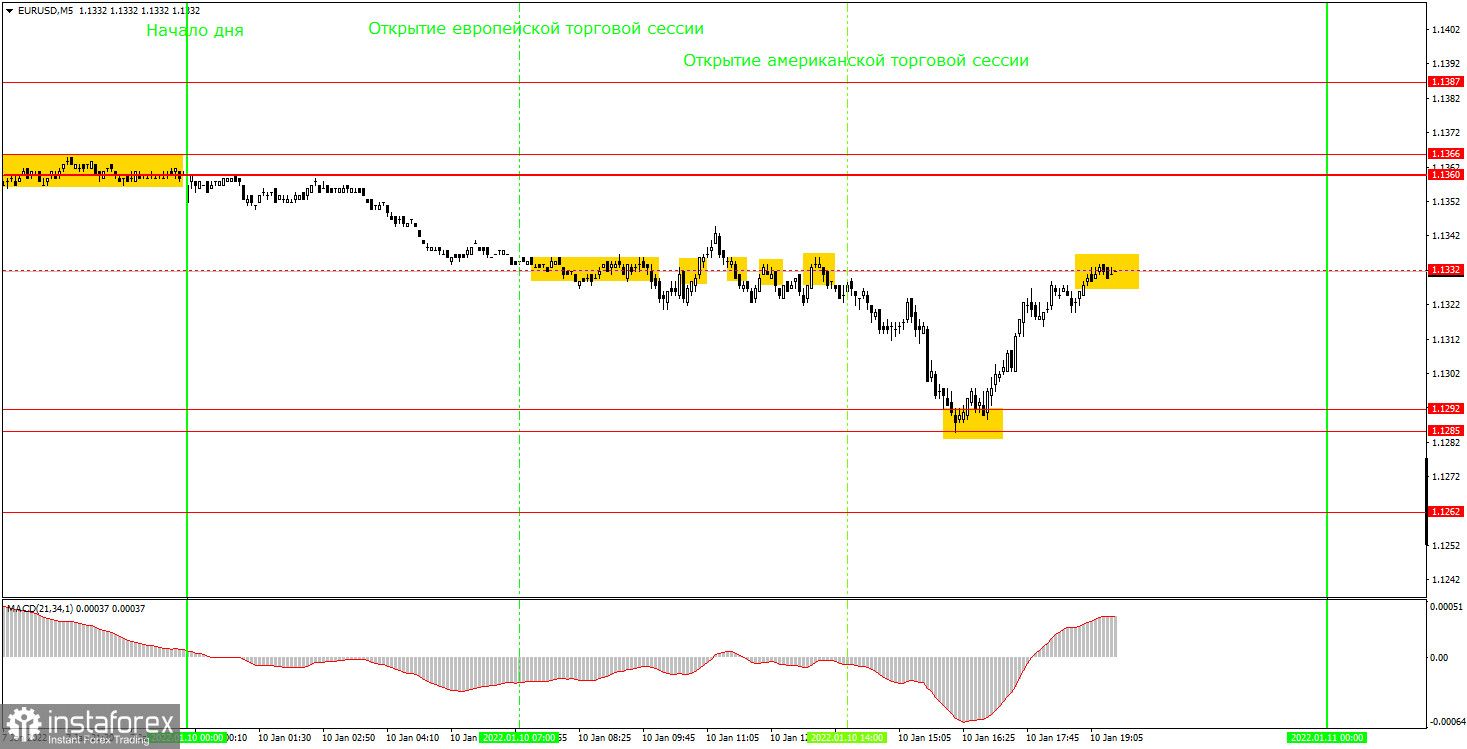
EUR/USD on 5M chart

On the 5-minute timeframe, the movement of the pair was far from perfect on Monday. In the course of the entire European session, the pair was stuck in one place near the level of 1.1332 which has lost its relevance by the end of today. However, 6 trading signals were formed around this level during the day, but most of them were false. Let's discuss how you should have traded on Monday. The first sell signal turned out to be false, and the price failed to decline even by 10 pips after its formation. Thus, after the price consolidated above the level of 1.1332, it was necessary to close the sell position manually and open a long one. However, a buy signal turned out to be false as well, and the price could not go up by even 10 pips. Therefore, we could not set the Stop Loss to a breakeven point for both trades. Each of them closed with a loss of 10 pips. The third, fourth, and fifth signals should have been ignored. By that time, two signals at the 1.1332 level had already proved to be false. At the same time, the signal that was formed on a rebound from the area of 1.1285-1.1292 should have been used for opening a trade. This was an accurate signal, and the price subsequently advanced to the level of 1.1332. You should have taken profit at this level, which amounted to about 35 pips and covered the losses from the first two trades.
Trading tips on Tuesday
On the 30-minute timeframe, the pair continues to trade sideways. The price is staying between the levels of 1.1234 and 1.1360. So, there is still no trend now, and it is extremely difficult to trade on this timeframe. Short positions could have been opened on a rebound from the level of 1.1360. You can keep them open for now, hoping for a fall to 1.1234 although it is very unlikely. On the 5-minute chart, the following levels are available on January 11: 1.1262, 1.1285-1.1292, 1.1360-1.1366, and 1.1387. We would like to remind you that it is necessary to set a Take Profit at 30-40 pips and a Stop Loss to a breakeven point as soon as the price passes 15 pips in the right direction. Trades can also be closed manually near important levels or after the formation of an opposite signal. There will not be any important macroeconomic releases on Tuesday, either in the US or in the EU. On the other hand, heads of both central banks, Jerome Powell and Christine Lagarde, will speak on Tuesday. Their statements may potentially affect the pair's trajectory.
On the chart
Support and Resistance Levels are the levels that serve as targets when buying or selling the pair. You can place Take Profit near these levels.
Red lines are channels or trend lines that display the current trend and show in which direction it is better to trade now.
The MACD indicator (14, 22, and 3) consists of a histogram and a signal line. When they cross, this is a signal to enter the market. It is recommended to use this indicator in combination with trend patterns (channels and trend lines).
Important announcements and economic reports that you can always find on the economic calendar can seriously influence the trajectory of a currency pair. Therefore, at the time of their release, we recommend trading as carefully as possible or exiting the market in order to avoid sharp price fluctuations.
Beginners on Forex should remember that not every single trade has to be profitable. The development of a clear strategy and money management is the key to success in trading over a long period of time.
 English
 Русский
 Bahasa Indonesia
 Bahasa Malay
 ไทย
ไทย Español
 Deutsch
 Български
 Français
 Tiếng Việt
 中文
中文 বাংলা
বাংলা हिन्दी
 Čeština
 Українська
 Română

