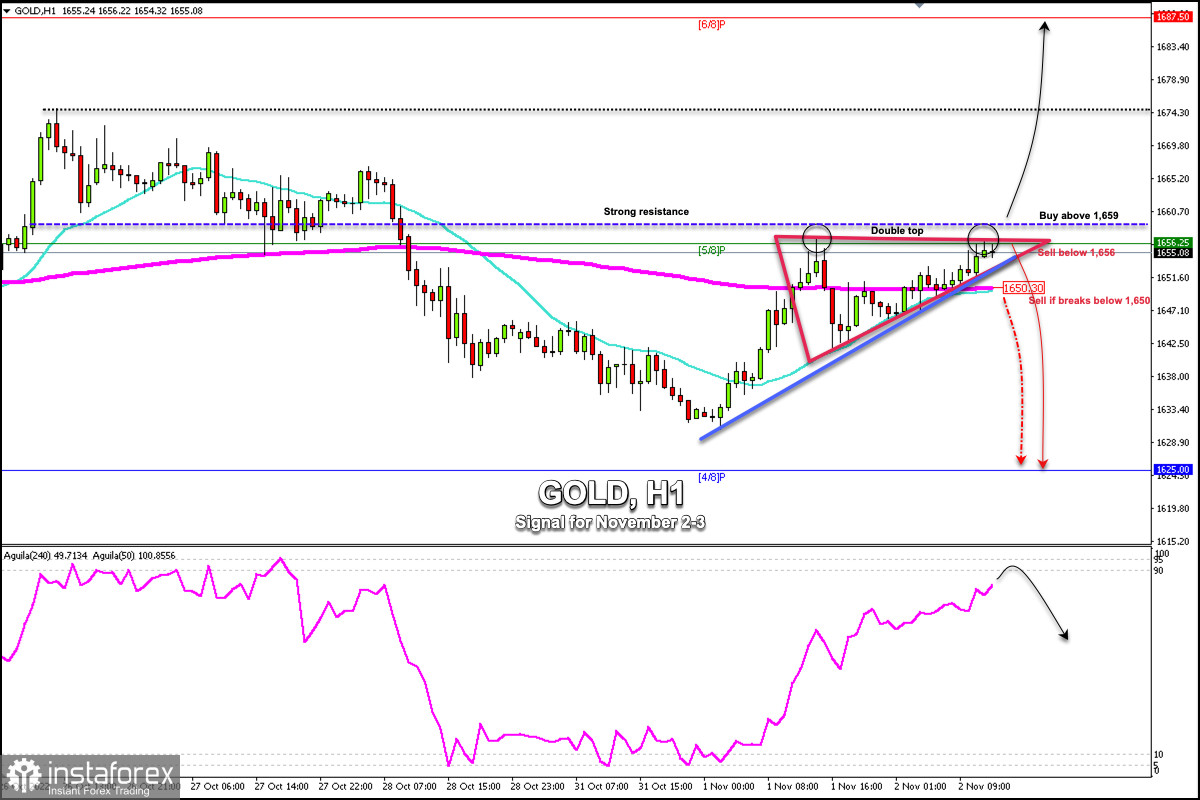
Early in the American session, Gold (XAU/USD) is trading around 1,655, above the 21 SMA, and 200 EMA (1,650). You can see the formation of the symmetrical triangle on the 1-hour chart. A sharp break above the strong resistance at 1,659 and a close on the 1-hour chart would trigger a bullish acceleration for the price to reach 1,675 and 1,687 (6/8).
On the other hand, in case gold breaks the symmetrical triangle below 1,650, we can expect a resumption of the bearish cycle and the price could fall back towards 4/8 Murray located at 1,625.
In the next few hours, the United States will publish the monetary policy decision: an increase of 0.75% is expected. If this decision is consistent with market expectations, we could expect a drop in gold.
On the contrary, if the actual rate hike is lower than expected or if the FED Chairman's speech does not provide a positive expectation for the future, we could expect gold to resume its bullish cycle and the price could rise from 1,660 and reach the level of 6/8 Murray at 1,687.
The eagle indicator on the 1-hour chart is reaching extremely overbought levels. We can also see that gold has formed a double-top pattern. In case this pattern prevails, we could expect confirmation for a bearish move and the price could drop below 1,650-1,625.
Our trading plan for the next few hours is to sell below 1,656 due to strong resistance located on the 1-hour chart or wait for a break and close below the 200 EMA located at 1,650 to sell with targets at 1,625.
 English
 Русский
 Bahasa Indonesia
 Bahasa Malay
 ไทย
ไทย Español
 Deutsch
 Български
 Français
 Tiếng Việt
 中文
中文 বাংলা
বাংলা हिन्दी
 Čeština
 Українська
 Română

