What is needed to open long positions on GBP/USD:
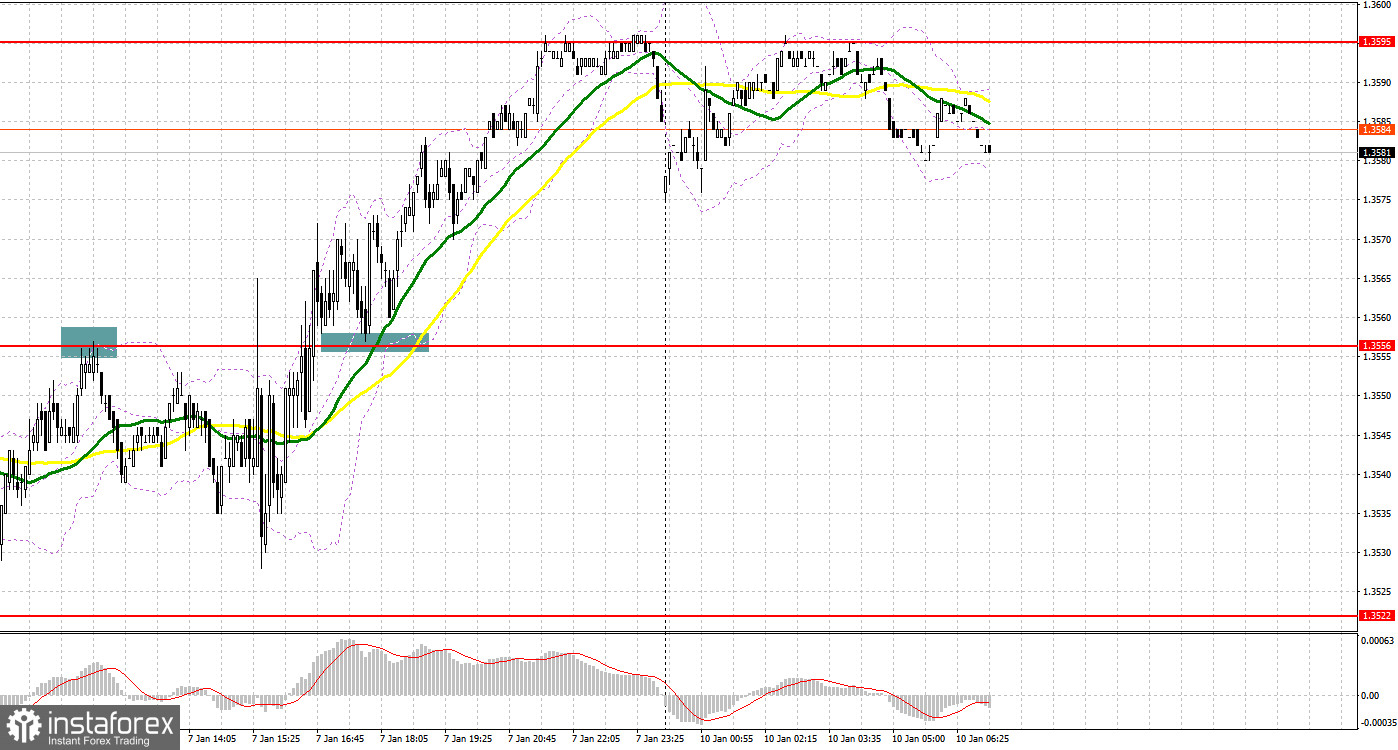
On Friday, there were several signals to enter the market. Let's take a look at the 5M chart and figure out what happened. In my morning forecast, I paid attention to the level of 1.3556 and recommended making decisions with this level in focus. In the first half of the day, the bulls' attempts to push the pair to new highs were unsuccessful. A false breakout at the level of 1.3556 led to the formation of a sell signal and to a decrease by 30 pips even before the release of the US Nonfarm Payrolls report. Already in the afternoon, when the figures for the US labor market were not so positive as expected in December, the US dollar declined. As a result, the GBP/USD pair broke above 1.3556. The downward test of this level led to the formation of a signal to open long positions. The pair managed to gain almost 50 pips.

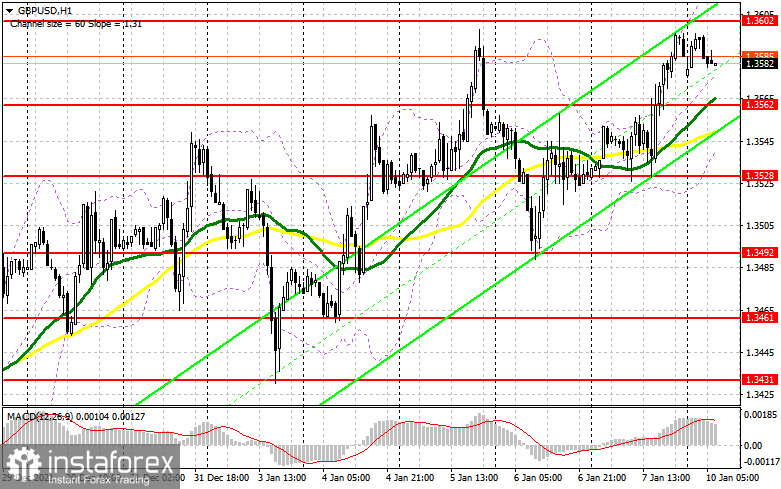
Today, the main aim of bulls is to protect the support level of 1.3562, which was formed last Friday. At this level, there are moving averages located in the positive zone. It should also help bulls assert strength. The formation of a false breakout at 1.3562 may give a buy signal with the prospect of a rise to 1.3602. The pair failed to reach this level at the end of last week. A breakout and an upward test of this level will give an additional entry point. It will also give support for bulls. They could push the price to the highs of 1.3649 and 1.3694. A more distant target will be the 1.3754 level where I recommend profit taking. If the pound sterling declines during the European session and the 1.3562 level is not broken, it would be better not to make hasty decisions but to wait until the price reaches 1.3528. If bulls defend this level, the upward movement may continue. Only the formation of a false breakout at 1.3528 will give an entry point with the prospects of the recovery of GBP/USD. It is recommended to open long positions of the pound sterling immediately after a price rebound from 1.3492 or even a lower low of 1.3461, bearing in mind a 20-25 pip intraday correction.
What is needed to open short positions on GBP/USD:
Bears protected monthly highs on Friday but lost ground after the publication of US NFP data. The protection of 1.3602 remains the primary task for today. If the price rises above this level, it will create a number of technical problems and lead to the formation of a new bullish trend. Today, there are no important macroeconomic statistics, so traders will be cautious. It is better to open short positions when bears protect monthly highs. The formation of a false breakout at the level of 1.3602 will give the first entry point into short positions. The pair may decline to 1.3562. Bears should exert significant pressure on the price as there are moving averages at this level that are located in the positive zone. A breakout of 1.3562 and a downward test will increase pressure on the pound sterling, pushing to the next support of 1.3528. Only the consolidation and an upward test of 1.3528 will give a new entry point into short positions with the prospect of a decline to 1.3492 and 1.3461 where I recommend taking profits. If the pair grows during the European session and the bears lack activity at around 1.3602, I would advise you to cancel selling there to the resistance level of 1.3649. It is also recommended to open short positions there only after a false breakout. The most sensible solution to sell GBP/USD would be selling straight after a drop off the resistance level of 1.3694 or from a higher high of 1.3754. Do not forget to allow for a 20-25 pip intraday correction.

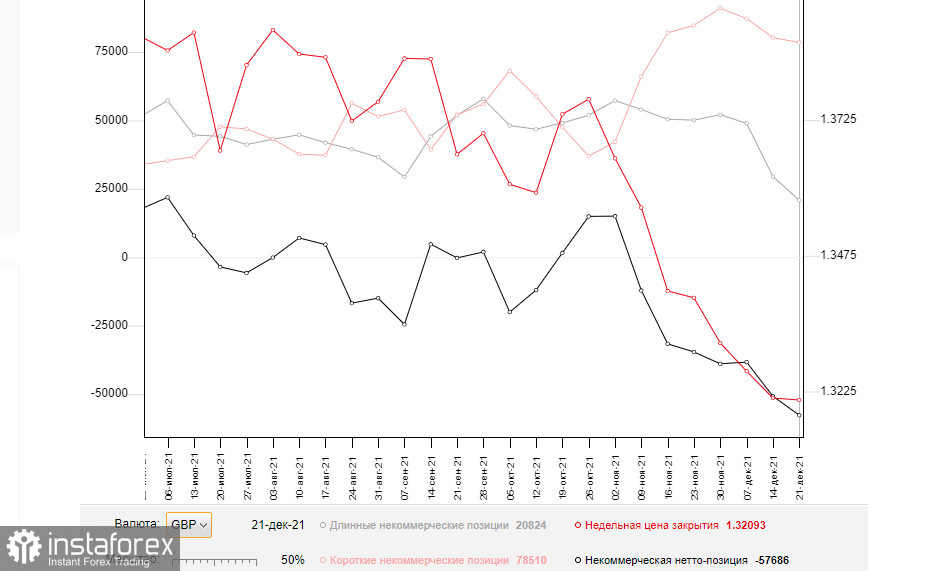
The COT report (Commitment of Traders) for December 28 showed a decline in both short and long positions. Taking into account that long positions have dropped much more, it has increased the negative value of the delta. The Fed and BoE meeting also influenced the content of the report. However, the pound sterling plunged after the rapid growth that occurred due to the interest rate hike. The prospects for the pound sterling look bright. The Bank of England's decision to raise the interest rate strengthened bullish momentum. A more aggressive policy of the regulator next year will certainly cement the bullish trend for the GBP/USD pair. High inflation remains the main reason why the Bank of England will continue to raise the interest rate. Yet, the US dollar may also gain momentum as the Fed plans to hike the benchmark rate in the spring of next year, which makes the US dollar more attractive. The COT report for December 21 indicated that the number of long non-commercial positions fell to 20,824 from 29,497, while the number of short non-commercial positions dropped to 78,510 from 80,245. This led to an increase in the number of negative non-commercial net positions to -57,686 from -50,748. The weekly closing price has hardly changed: 1.3209 versus 1.3213 a week earlier.

Signals of technical indicators
Moving averages
GBP/USD is trading above 30- and 50-period moving averages. It means that the bulls do not give up attempts to carry on with an upward movement.
Remark. The author is analyzing a period and prices of moving averages on the 1-hour chart. So, it differs from the common definition of classic daily moving averages on the daily chart.
Bollinger Bands
If the price declines, the lower limit of 1.3545 will act as support. If the price rises, the upper limit of 1.3610 will act as resistance.
Definitions of technical indicators
- Moving average recognizes an ongoing trend through leveling out volatility and market noise. A 50-period moving average is plotted yellow on the chart.
- Moving average identifies an ongoing trend through leveling out volatility and market noise. A 30-period moving average is displayed as the green line.
- MACD indicator represents a relationship between two moving averages that is a ratio of Moving Average Convergence/Divergence. The MACD is calculated by subtracting the 26-period Exponential Moving Average (EMA) from the 12-period EMA. A 9-day EMA of the MACD called the "signal line".
- Bollinger Bands is a momentum indicator. The upper and lower bands are typically 2 standard deviations +/- from a 20-day simple moving average.
- Non-commercial traders - speculators such as retail traders, hedge funds and large institutions who use the futures market for speculative purposes and meet certain requirements.
- Non-commercial long positions represent the total long open position of non-commercial traders.
- Non-commercial short positions represent the total short open position of non-commercial traders.
- The overall non-commercial net position balance is the difference between short and long positions of non-commercial traders.
 English
 Русский
 Bahasa Indonesia
 Bahasa Malay
 ไทย
ไทย Español
 Deutsch
 Български
 Français
 Tiếng Việt
 中文
中文 বাংলা
বাংলা हिन्दी
 Čeština
 Українська
 Română

