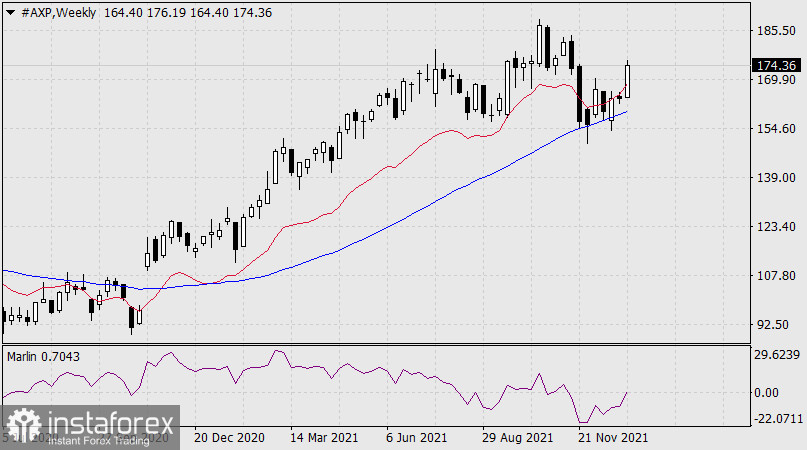
Buying shares of US financial company American Express stock (#AXP). On the weekly chart, the price broke above the balance indicator line. As a result, market players shifted their focus to long positions in the medium term. Before that, the price bounced twice from the Kruzenshtern indicator line. The Marlin Oscillator moved into the zone of positive values.

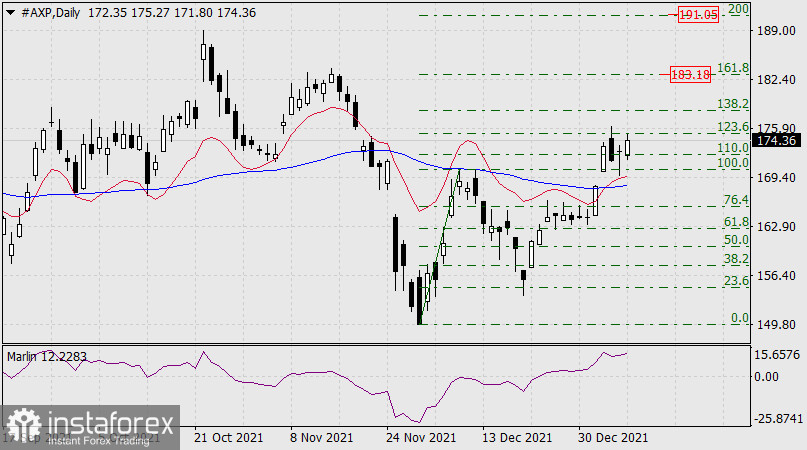
According to the daily chart, the price has consolidated above both indicator lines. The Marlin Oscillator is rising in the positive area. The first target of bulls is the 161.8% Fibonacci level, that is the 183.18 mark located near the high posted on November 15, 2021. If the price overcomes this level, the way to the second target of 191.05, the 200% Fibonacci level, will open.

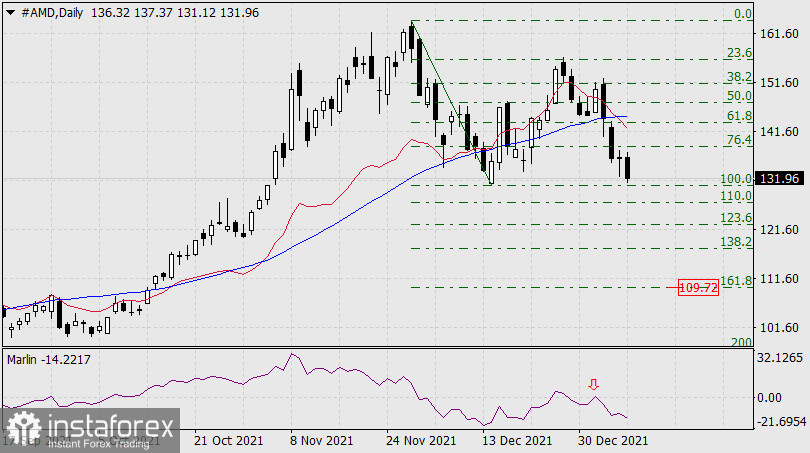
Selling shares of US manufacturer of integrated circuits Advanced Micro Devices (#AMD). According to the daily chart, the price has reached the 100% Fibonacci level (the low of December 14, 2021) and is currently moving downwards below the Kruzenshtern indicator line. If the price falls below this level, it will extend losses. The Marlin Oscillator has turned down from the zero line. The target of bears is the 109.72 mark which coincides with the 161.8% Fibonacci level.

 English
 Русский
 Bahasa Indonesia
 Bahasa Malay
 ไทย
ไทย Español
 Deutsch
 Български
 Français
 Tiếng Việt
 中文
中文 বাংলা
বাংলা हिन्दी
 Čeština
 Українська
 Română

