Analysis of previous deals:
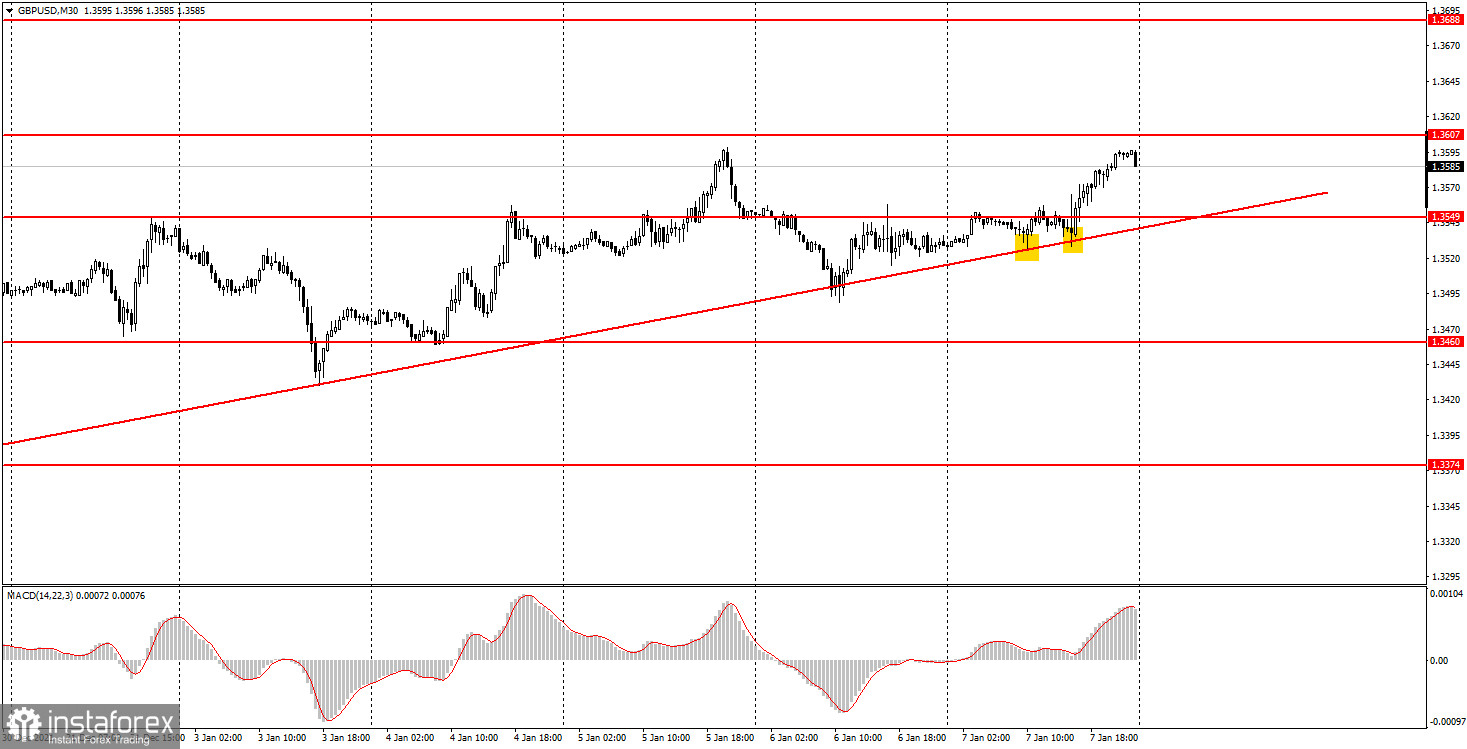
30M chart of the GBP/USD pair

The GBP/USD pair bounced off the upward trend line twice on Friday and resumed the upward movement. Thus, on the last trading day of the week, the pound rose in price again, but this time it would be appropriate to say that macroeconomic statistics helped it in this. As we have already said, three important reports were published in the United States, but traders paid attention only to the Nonfarm report. Therefore, in the second half of the day, the US currency fell against all its main competitors, including the pound. The fact is that the aforementioned report turned out to be weaker than forecasts and expectations, therefore, short positions on the dollar followed in the US session on Friday. And the pound, which aims to surpass the upward trend line, had gone up from it once again. However, it failed to overcome its previous local high. And the upward movement itself has been going on for more than three weeks, practically without a single pullback. Therefore, we are inclined to believe that the trend line will be overcome in the new week and a downward correction will begin.
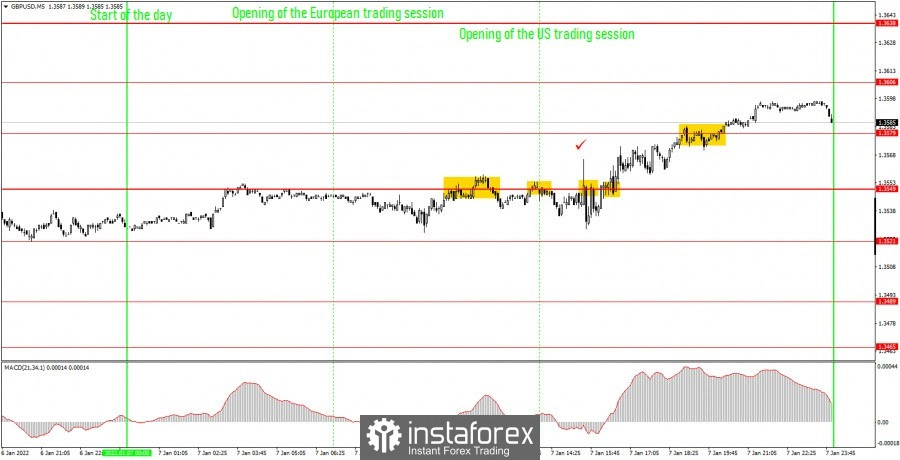
5M chart of the GBP/USD pair

The movement of the pound/dollar pair is quite difficult on the 5-minute timeframe. The movement was sideways for almost the entire day, although on the 30-minute TF it looks like a continuation of the trend. However, upon closer inspection, it is clear that the movement began only in the second half of the US session. Not even immediately after the publication of US statistics (ticked). Thus, before the upward movement began, the pair managed to form at least three false trading signals around the level of 1.3549. In addition, we also note weak volatility, despite important statistics - only about 70 points. However, if desired, it was possible to trade on Friday. On the first two sell signals, when the price bounced off the 1.3549 level, one should have opened one short position. And to close it on the eve of the publication of NonFarm Payrolls manually, since this time there were no options with setting Stop Loss. Thus, there was no need to risk it. The third sell signal, of course, should not have been worked out, since the US reports were published at that time. The fourth buy signal could be worked out, but could be skipped. In the first case, novice traders could have earned about 30 points, but this signal was not obvious.
How to trade on Monday:
The upward trend persists on the 30-minute TF, but if the pair settles below the trendline tomorrow, then, most likely, a new downward trend will begin. Albeit short-term. Therefore, at this time, long positions on this TF remain relevant. It is recommended to trade at the 5-minute TF tomorrow at the levels of 1.3521, 1.3549, 1.3579, 1.3606, 1.3638. The price can bounce off these levels, or it can overcome them. As before, we set Take Profit at a distance of 40-50 points. At the 5M TF, you can use all the nearest levels as targets, but then you need to take profit, taking into account the strength of the movement. When passing 20 points in the right direction, we recommend setting Stop Loss to breakeven. No major report will be published in the UK or the United States tomorrow, no major event scheduled. Thus, on Monday, beginners will have to trade exclusively using the "technique", and the volatility may be low.
On the chart:
Support and Resistance Levels are the Levels that serve as targets when buying or selling the pair. You can place Take Profit near these levels.
Red lines are the channels or trend lines that display the current trend and show in which direction it is better to trade now.
The MACD indicator (14,22,3) consists of a histogram and a signal line. When they cross, this is a signal to enter the market. It is recommended to use this indicator in combination with trend lines (channels and trend lines).
Important speeches and reports (always contained in the news calendar) can greatly influence the movement of a currency pair. Therefore, during their exit, it is recommended to trade as carefully as possible or exit the market in order to avoid a sharp price reversal against the previous movement.
Beginners on Forex should remember that not every single trade has to be profitable. The development of a clear strategy and money management are the key to success in trading over a long period of time.
 English
 Русский
 Bahasa Indonesia
 Bahasa Malay
 ไทย
ไทย Español
 Deutsch
 Български
 Français
 Tiếng Việt
 中文
中文 বাংলা
বাংলা हिन्दी
 Čeština
 Українська
 Română

