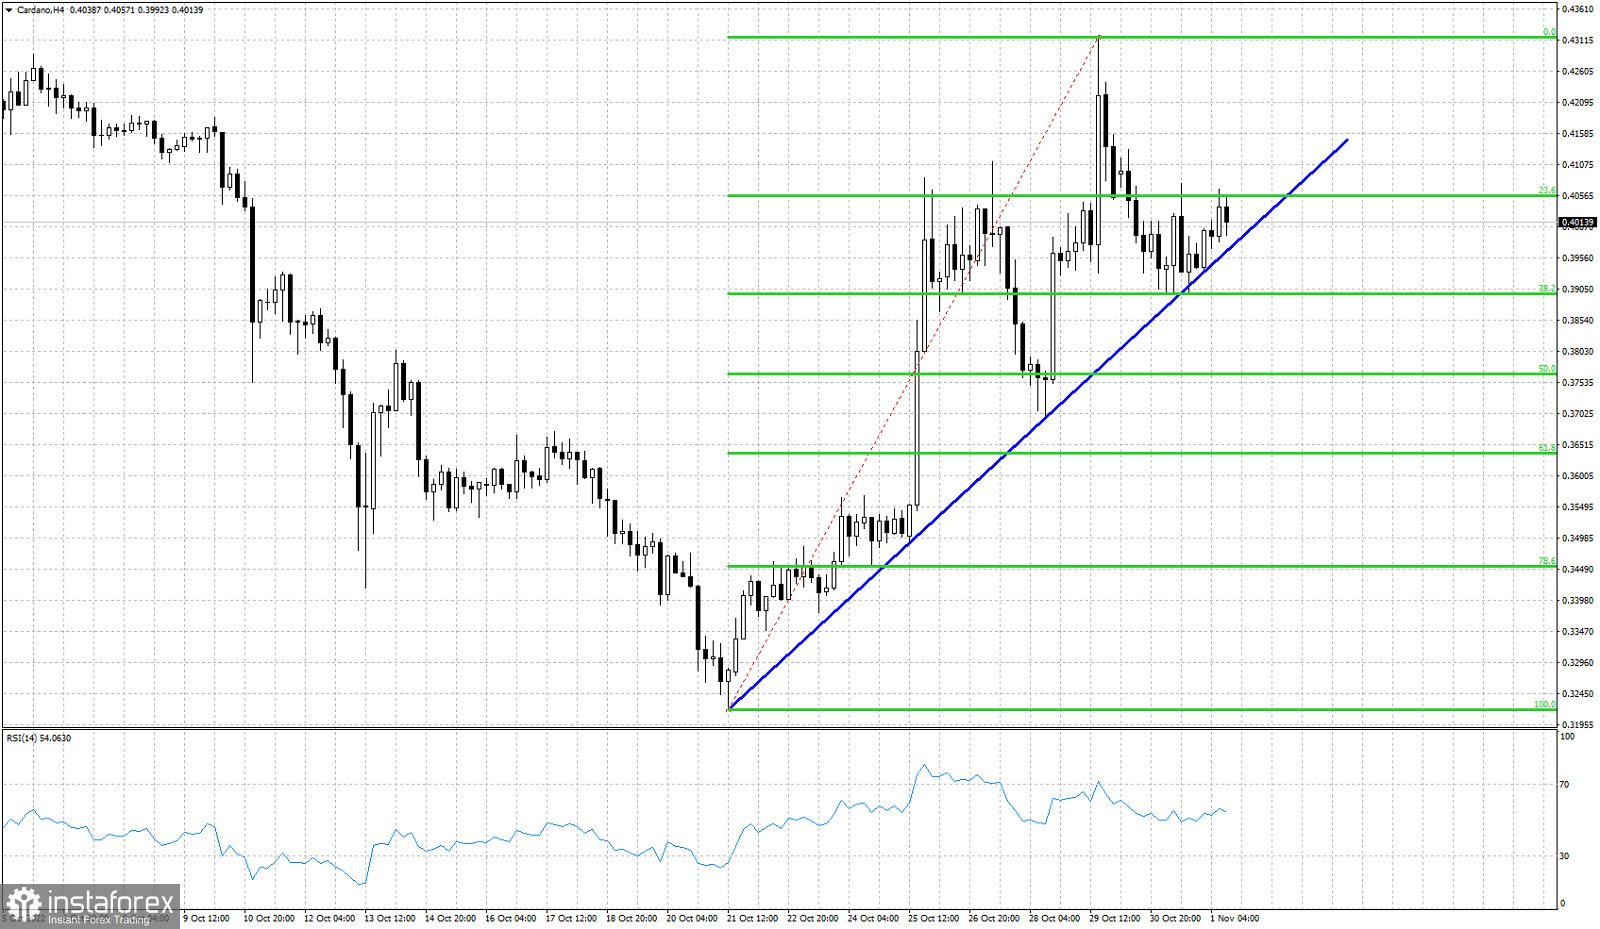
Green lines- Fibonacci retracements
Blue line- support trend line
Cardano is trading around $0.40 after a steady rise from $0.3219. Price is consistently forming higher highs and higher lows supporting the bullish momentum. An upward sloping trend line connecting the lows of the current price formation can help us identify a potential bearish or reversal signal. Support is found at $0.3970. A break below this level would be a sign of weakness. Failure to stay above the blue trend line, will open the way for a deeper pull back towards the 61.8% Fibonacci retracement at $0.3640. At $0.4075 we find the short-term resistance that has already been tested twice and bulls failed to break above it. Recapturing $0.4075 would be the first step towards challenging the recent highs at $0.43.
 English
 Русский
 Bahasa Indonesia
 Bahasa Malay
 ไทย
ไทย Español
 Deutsch
 Български
 Français
 Tiếng Việt
 中文
中文 বাংলা
বাংলা हिन्दी
 Čeština
 Українська
 Română

