Technical Market Outlook:
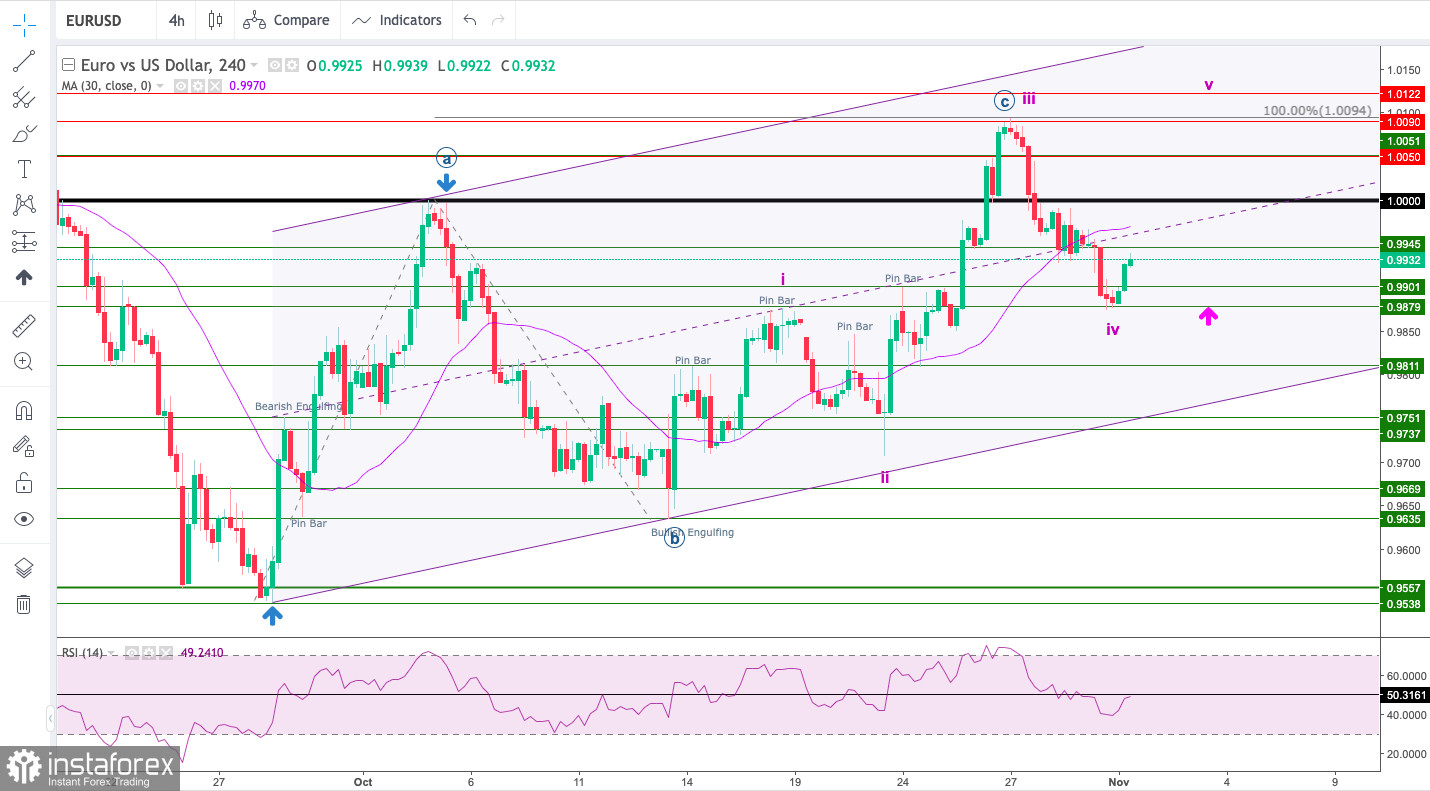
On the Daily time frame chart of EUR/USD there is a clear Bearish Engulfing candlestick pattern visible at the 1.0094 level, so the bears are in control of this market and should built more pressure. The recent 1:1 correction to the level of 1.0094 (wave A is equal in length to wave B) was terminated and then market reversed lower, towards the technical support located at 0.9879. In the longer term, the key technical resistance level is located at 1.0389 (swing high from August 11th), so the bulls still have a long road to take before the down trend reversal is confirmed. The mid and long-term outlook for the EUR remains bearish (ABC corrective cycle in the down trend) until the swing high seen at 1.0389 is clearly broken. The chance for an impulsive wave development to the upside are now lower as the level of 0.9879 was slightly violated during the down move for wave 4.

Weekly Pivot Points:
WR3 - 1.00027
WR2 - 0.99756
WR1 - 0.99586
Weekly Pivot - 0.99485
WS1 - 0.99315
WS2 - 0.99214
WS3 - 0.98943
Trading Outlook:
The EUR had made a new multi-decade low at the level of 0.9538, so as long as the USD is being bought all across the board, the down trend will continue towards the new lows. In the mid-term, the key technical resistance level is located at 1.0389 and only if this level is clearly violated, the down trend might be considered terminated. Please notice, there is plenty of room to the downside for the EUR to go, all of the potential technical support level are very old and might not be much reliable anymore.
 English
 Русский
 Bahasa Indonesia
 Bahasa Malay
 ไทย
ไทย Español
 Deutsch
 Български
 Français
 Tiếng Việt
 中文
中文 বাংলা
বাংলা हिन्दी
 Čeština
 Українська
 Română

