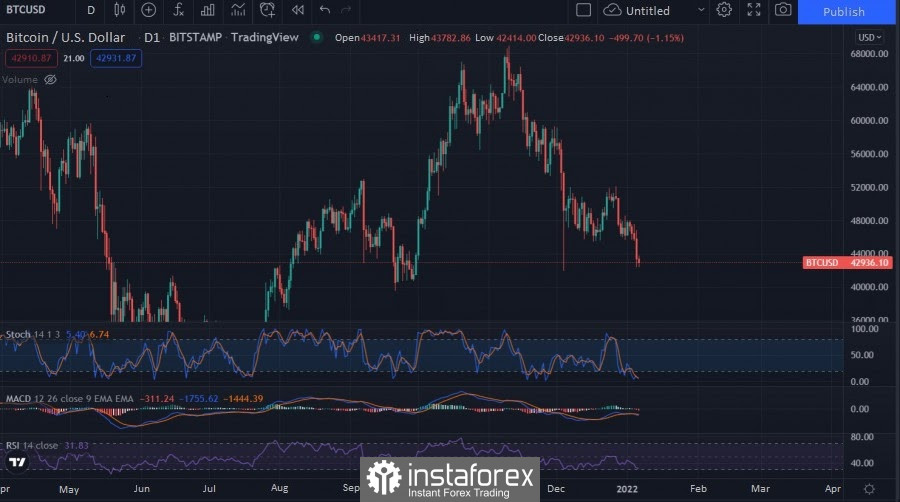
After a month of uncertainty, Bitcoin breaks through the 32-day support line and declines to the $42k–$45k area. The cryptocurrency managed to find the bottom around $42.5k, but the situation continues to be tense, as the asset is getting closer to the bottom of the upward trend. If this milestone falls, like the others, then the probability of a bullish scenario will be canceled in the near future.
Over the past day, Bitcoin has fallen in price by 9% and made a powerful impulse downward movement. The key support levels at $46.3k and $45.6k were simultaneously broken, and as of 09:30 UTC the asset is trading in the $42.8k region. Due to the collapse of the BTC price, traders lost $810 million due to the forced liquidation of 208,000 long positions.
The fall in the price of Bitcoin was caused by the shutdown of the Internet in Kazakhstan, which is the second largest cryptocurrency mining country in the world. The second reason for the fall in Bitcoin was the Fed's statement about its readiness to raise the key rate due to rising inflation.

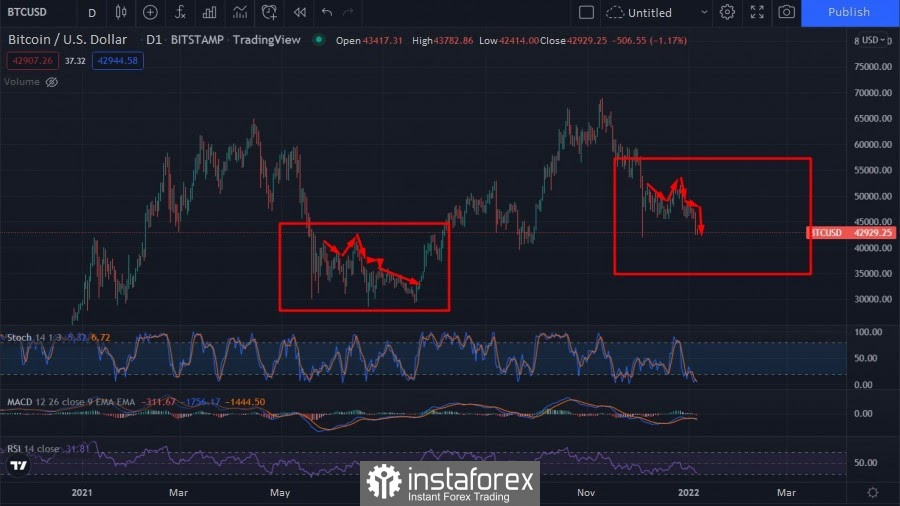
The movement in the price of the digital asset completely coincides with the May period. The price continued to fall after a false breakout of the key support zone. But the current situation looks more complicated, as the cryptocurrency is very close to an important support zone at $42.2k.
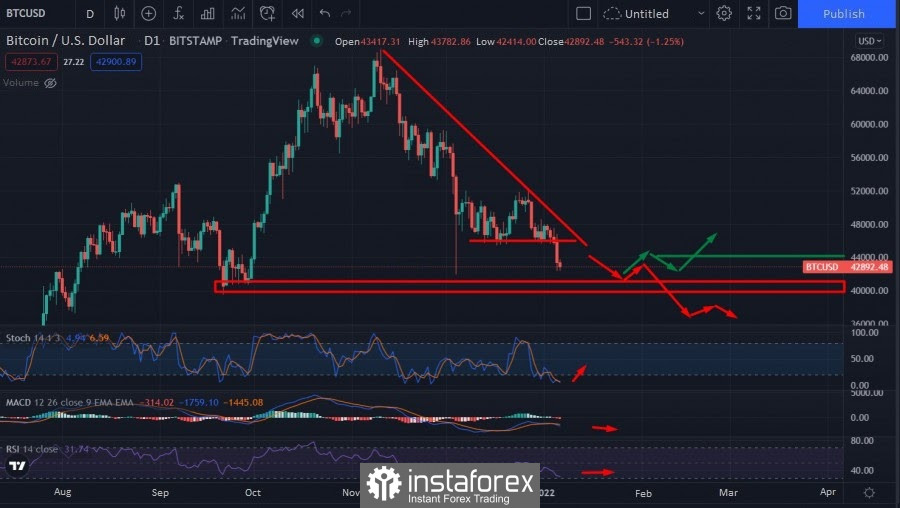
This is the final wide-range support level that BTC has been brewing over the past month. The likelihood of a rebound from this area is greatly increased by the large buying volumes and liquidity. If the asset breaks through this area as well, then the scenario for the recovery of BTC/USD quotes within the framework of a long-term upward trend needs to be revised.

At the current stage, I am considering two scenarios of what is happening. If the price manages to stabilize and form a pool of purchases, then you can open a long position up to $44.2k. At the same time, it is worth insuring with a stop in the $41.8k–$41.9k area. In a negative scenario, another squeeze should be expected at least up to the $36k–$38k range.

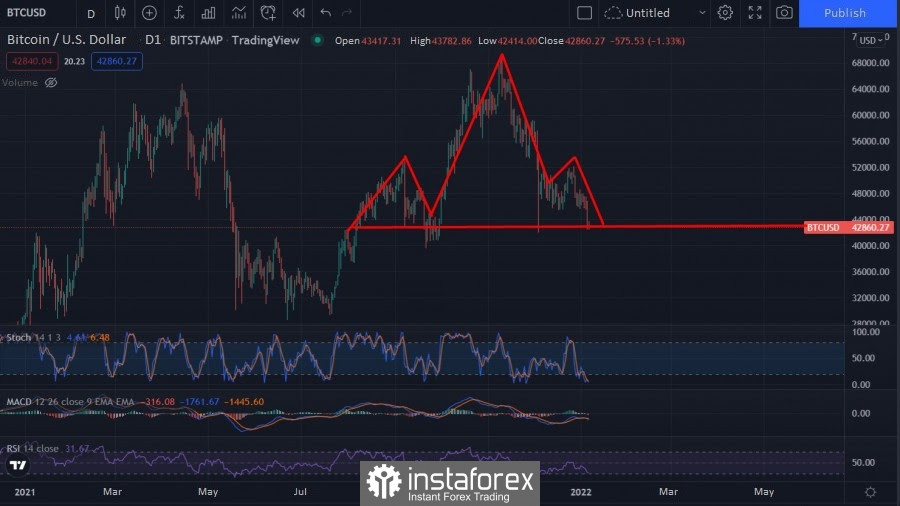
It is important to note that on the daily chart, Bitcoin is on the verge of completing the head and shoulders pattern. The completion of the shoulder line will indicate a wide trend reversal with $20k–$25k potential. It is in the area of $42.2k that the shoulder line will be completed, therefore keeping this line is the main task of the bulls. The market is one step away from a bear market, but I will stick to a scenario where liquidity and buying volumes push the price above $44k.

 English
 Русский
 Bahasa Indonesia
 Bahasa Malay
 ไทย
ไทย Español
 Deutsch
 Български
 Français
 Tiếng Việt
 中文
中文 বাংলা
বাংলা हिन्दी
 Čeština
 Українська
 Română

