In the first two trading days of the new week, we summed up the results of the December and weekly trading on three major currency pairs - EUR/USD, GBP/USD and USD/JPY. I think it would be unfair to ignore another major currency pair USD/CHF. In this regard, I propose to analyze the technical picture of this trading instrument, which is observed at the two most senior time intervals.
Monthly

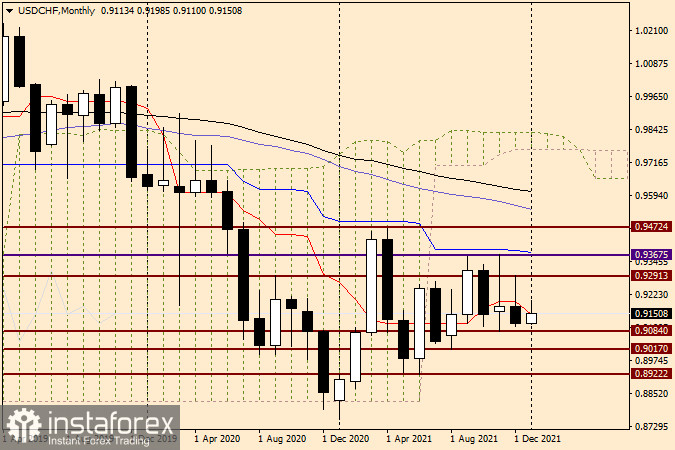
So, as can be clearly seen on the monthly timeframe, December trading was dictated by bears and the pair ended last month with a decline, closing December and 2021 at 0.9113. I think that the technical picture for this currency pair has an ambiguous look. On the one hand, the important and strong technical level of 0.9100 stood and was not broken. I also recommend paying attention to the shape of the December candle. According to long-term observations, after the appearance of such candles, there is often a movement of the exchange rate in the opposite direction, that is, the growth of the quote. The bears' USD/CHF asset should include the fact that they have managed to close the Tenkan of the Ichimoku indicator under the red line for the last two months. The January trading, which started on January 3, the pair started quite positively, but there is still a lot of time ahead and many important significant events that can make changes to the current balance of power. At the moment, the monthly range in which the dollar /franc is traded can be designated as 0.9084-0.9291 and assume that exiting it will give a more complete idea of the further direction of the price.
Weekly

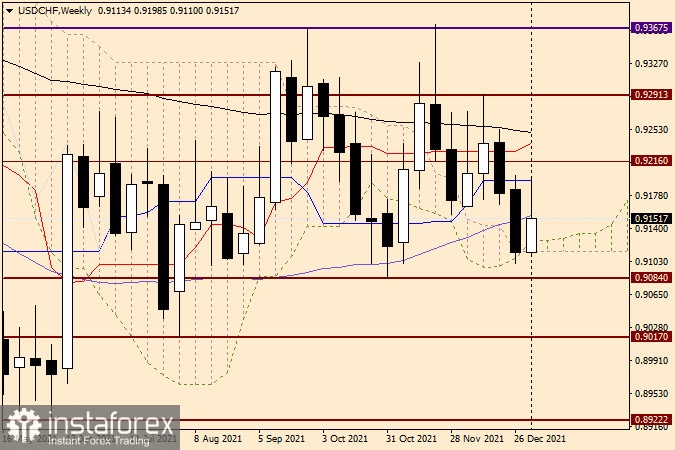
The last week of last year also ended with a decrease in the quote. Bulls' attempts to implement an upward scenario using this instrument encountered strong resistance, which was provided to the pair by the blue Kijun line of the Ichimoku indicator. After that, the course turned in a southerly direction, broke through the 50 simple moving average and stopped within the Ichimoku cloud. In less than three trading days of the first week of the new year, the pair has already risen again to the Kijun line, which runs right under the strong and important technical level of 0.9200. And again, the players on the rate increase failed, as can be judged by the current and rather long upper shadow of the candle. However, two of the most important events that can fundamentally change the situation are still ahead. FOMC minutes will be published today at 19:00 London time, and on Friday, January 7, data on the US labor market will be released.
With a high degree of probability, it can be assumed that these landmark events will have a significant impact on the price dynamics of USD/CHF. At the time of completion of this article, the market is stuck near another strong technical level of 0.9150 and cannot decide on the further direction of price movement. In this regard, I recommend not to rush to open new positions on the dollar/franc pair yet, especially today, when the FOMC protocols are expected to be published. On such days, you can always expect various surprises, including unpleasant ones. For those who still decide to trade today, you need to be prepared for the possible strong volatility that will manifest itself after the publication of the Fed minutes. In my personal opinion, judging by the technical picture, a little more priority is given to sales, which I recommend considering near the 0.9175 and 0.9200 marks. The confirmation signal for opening short positions will be the appearance of bearish candlestick analysis patterns under the indicated marks on smaller time intervals, specifically on the four-hour and (or) hourly charts.
 English
 Русский
 Bahasa Indonesia
 Bahasa Malay
 ไทย
ไทย Español
 Deutsch
 Български
 Français
 Tiếng Việt
 中文
中文 বাংলা
বাংলা हिन्दी
 Čeština
 Українська
 Română

