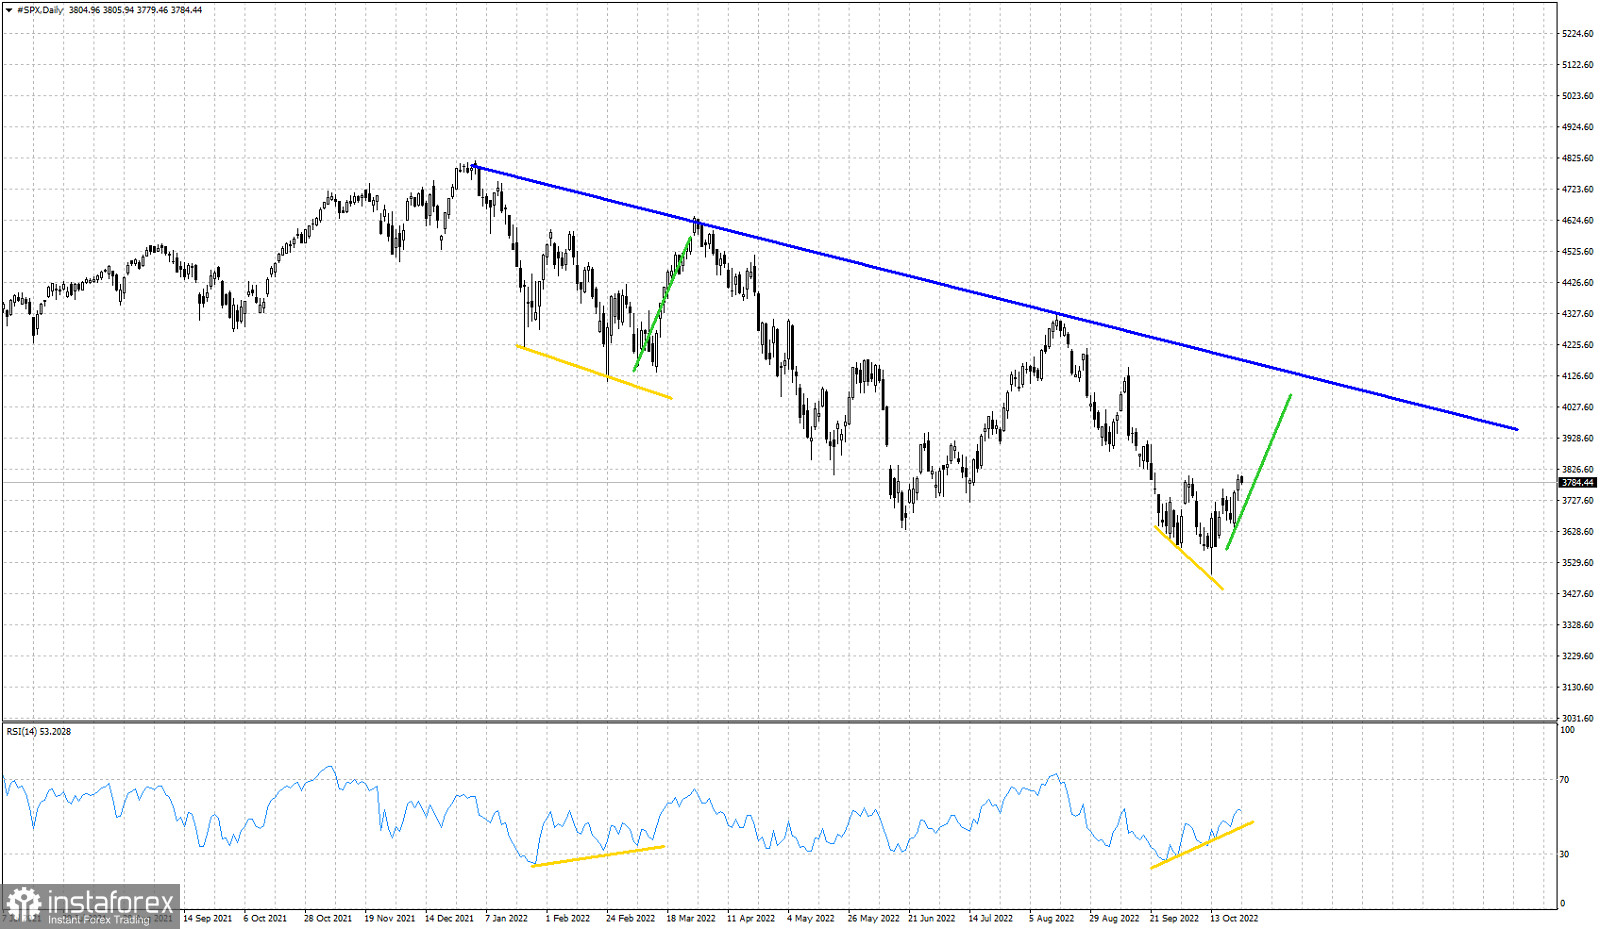
Blue line- resistance trend line
Yellow lines- bullish RSI divergence
Green line- likely direction similar to March
SPX is showing reversal signs over the last few weeks. Price has made an important low around 3500 around October 13th. Now at 3780 and price starting to make higher highs and higher lows, there are increased chances we see a repeat in SPX bounce as it did back in March. The RSI is turning upwards from oversold levels and after a couple bullish divergence signals. There is upside potential towards 4,000 price level. Bulls do not want to see price break below the recent higher low of 3630. A break below this level will diminish dramatically the chances of the bullish scenario.
 English
 Русский
 Bahasa Indonesia
 Bahasa Malay
 ไทย
ไทย Español
 Deutsch
 Български
 Français
 Tiếng Việt
 中文
中文 বাংলা
বাংলা हिन्दी
 Čeština
 Українська
 Română

