EUR/USD analysis on daily chart

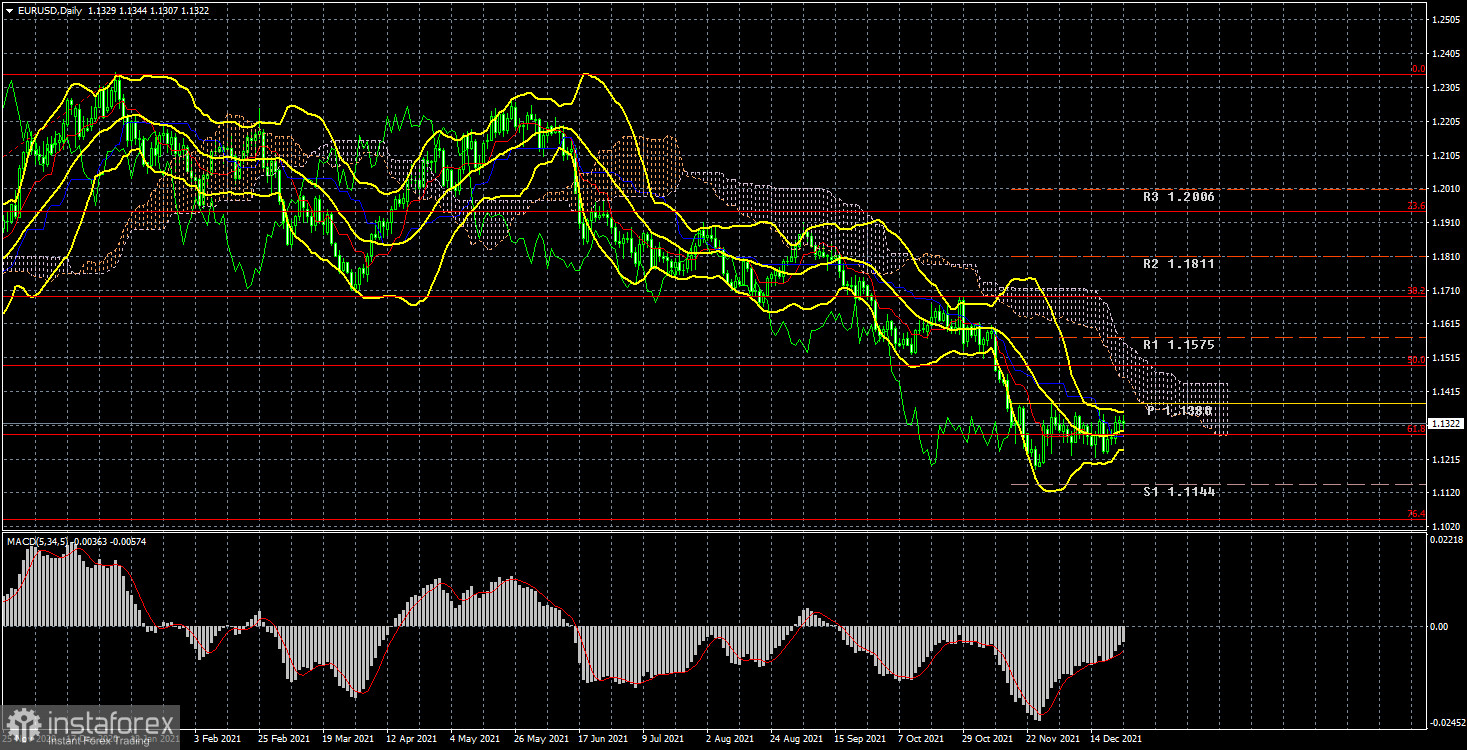
The EUR/USD pair continued to remain inside the sideways channel during the current week. This can be seen on the chart above. In general, the technical picture has not changed for a month. All this time EUR/USD has been trading near 61.8% Fibonacci - 1.1288, in the 120 pips wide sideways channel. Thus, even the formal breakout of the critical line does not play any role now, for it is not the price that has consolidated above the important line, but the line itself has fallen below the price. This is a fundamental difference. Therefore, it is impossible to make a conclusion about the beginning of correction now. Moreover, if this week the pair's sideways movement was justified, as there was no macroeconomic statistics and fundamental background, then during the previous three weeks the pair was moving in the flat exclusively on its initiative. As a result, the current downtrend persists and at any moment it may resume its downward movement. Bulls show lack of activity week after week, so it is unclear what to expect from the euro now. There was not a single interesting event in the EU or the US this week. The market was discussing the new strain of Omicron during the week, which continues to spread at a high rate in both EU countries and the US. However, Joe Biden has already said that he is going to fight the new strain solely with vaccination and revaccination, and there is no talk of shutting down the economy for a lockdown. In the European Union, several countries have imposed lockdowns, but most counties do not intend to do so. Yesterday, it also became known that Omicron strain leads to hospitalizations 2-3 times less often than Delta strain. This news eased tensions in the market.
COT report analysis

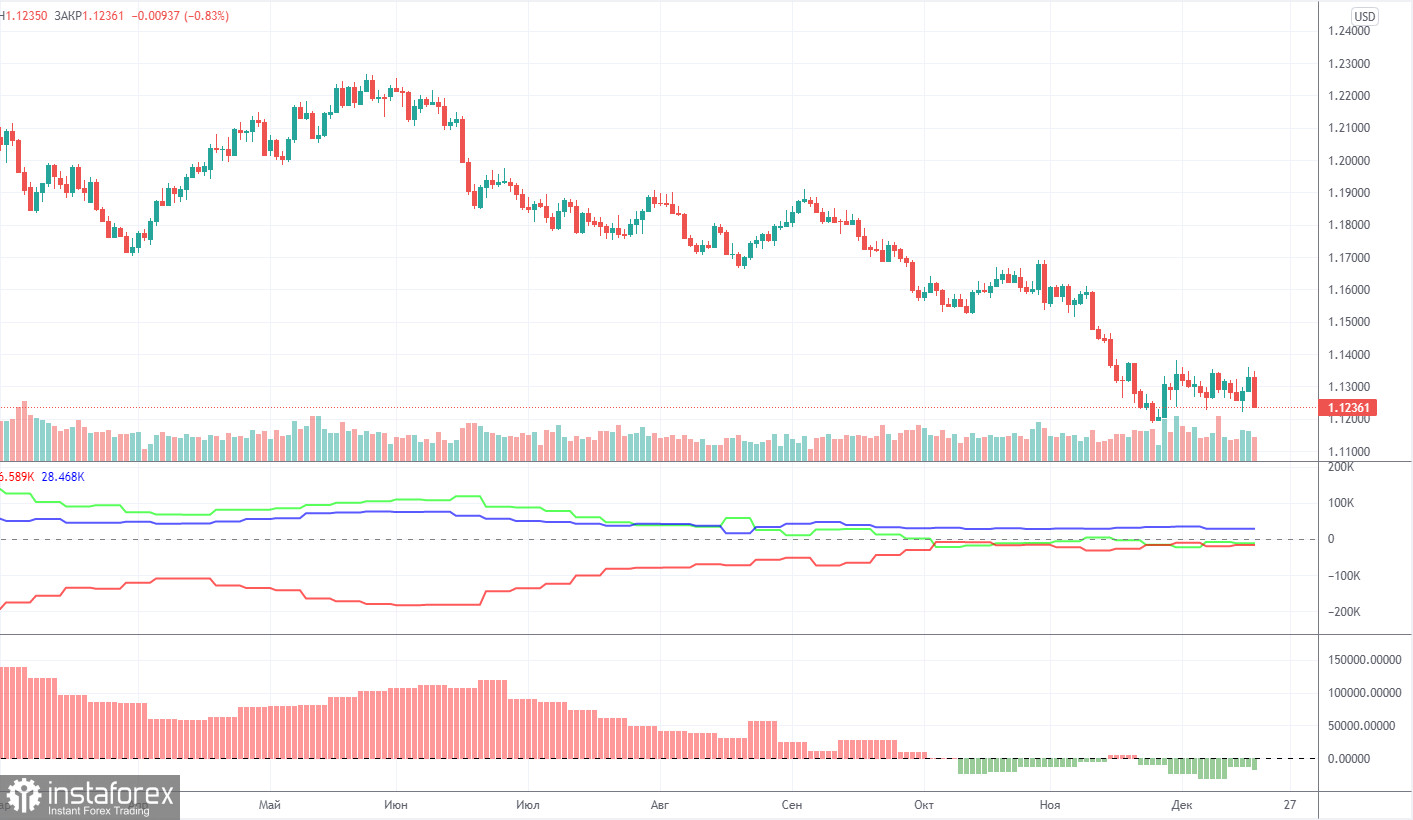
During the last reporting week (December 7 - 13), the mood of non-commercial traders became slightly more bearish. The "Non-commercial" group of traders now has more short positions open than long ones, but this difference is not significant. The difference is only 18,000 contracts, which is not much. During the reporting week professional traders closed 7,200 buy contracts and 2,800 sell contracts. Thus, the net position of professional players decreased by 4,000. However, the main thing is that the green and red lines of the first indicator (indicating the change in the net positions of the "Non-commercial" and "Commercial" groups) have been near the zero level for a long time, as well as close to each other. That is, in the last few months, when the euro continued to fall against the US dollar, the big players stopped opening short positions. Thus, the question arises, why was the euro falling at all, if the market participants didn't sell it out? Perhaps, global factors, like the change of the balance between the money supply in the EU and the US, interfere with the rate-making process. We can only conclude from the COT reports that the bearish sentiment is minimal and has not increased in recent months. Nonetheless, given the fundamental background, the decline in the euro might continue. The technical picture does not give any reasons to assume that the decline of the euro is over. Big players' sentiment remains bearish and bulls do not intend to change anything. The new COT report was not released on Friday due to the Christmas holiday.
Fundamental data analysis
There is almost a complete absence of fundamental data this week. Notably, nothing influenced the traders' sentiment or the trend of the EUR/USD pair. However, even a week before the results of the ECB and Fed meetings were summed up, the pair remained in the same sideways channel. So, the pair is flat now and there is nothing we can do about it and hardly anything will change next New Year's week.
Trading plan for December 27 - 31:
1) On the daily chart the trend remains downward. However, the movement itself in recent weeks is flat. So, the downside movement may continue at any moment with the support levels of 1.1144 and 1.1038 (76.4% Fibonacci), but most likely, it may happen next year. The general fundamental background at the moment supports a further drop of the euro and growth of the US dollar. The only hope for the euro is that all the growth factors of the US dollar have already impacted the market.
2) As for the long positions in the euro/dollar pair, traders should refrain from opening them before the price fixes above the Ichimoku cloud, because the price has already broken through the Kijun-sen several times, but then could not continue to move up. There are no prerequisites for a new uptrend to start shortly.
Descriptions to charts:
Price levels of support and resistance (resistance/support), Fibonacci levels, which are target levels for the opening of purchases or sales. Take-profit orders may be placed near them.
Indicators Ichimoku cloud (standard settings), Bollinger Bands (standard settings), MACD (5, 34, 5).
Indicator 1 on the COT charts - the size of the net position of each group of traders.
Indicator 2 on the COT charts - the size of the net position for the "Non-commercial" group.
 English
 Русский
 Bahasa Indonesia
 Bahasa Malay
 ไทย
ไทย Español
 Deutsch
 Български
 Français
 Tiếng Việt
 中文
中文 বাংলা
বাংলা हिन्दी
 Čeština
 Українська
 Română

