Technical outlook:
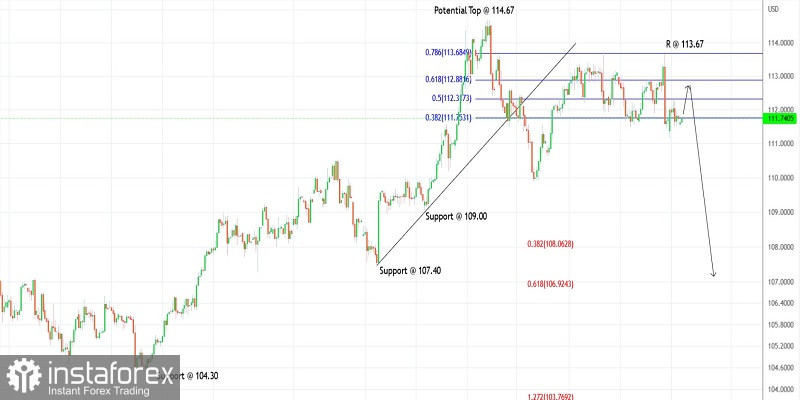
The US dollar index might have carved a potential resistance around 113.67 last week as prices reversed sharply lower towards 111.14 thereafter. The index is seen to be trading close to 111.75 at this point as traders prepare to pull back towards the 112.30-50 area before pushing the price lower again. Ideally, prices would stay below 113.67 going forward.
The US dollar index could be into its last leg lower towards 107.00 to complete its larger-degree corrective drop, which had begun from the 114.67 mark earlier. If the above-proposed structure holds well, prices would stay below 113.67 and continue dragging lower towards 107.00 in the next several trading sessions. Near-term resistance is seen through the 112.30-50 zone, which might be tested before turning lower again.
The index is facing immediate resistance at 113.67, followed by 114.67 while interim support is close to 110.00, followed by 109.00 and lower respectively. A break below 110.00 will accelerate prices quickly towards 109.00 and 107.00 levels going forward. On the flip side though, a break above 113.67 will bring back the bulls into control.
Trading idea:
Potential drop through 107.00 against 115.00
Good luck!
 English
 Русский
 Bahasa Indonesia
 Bahasa Malay
 ไทย
ไทย Español
 Deutsch
 Български
 Français
 Tiếng Việt
 中文
中文 বাংলা
বাংলা हिन्दी
 Čeština
 Українська
 Română

