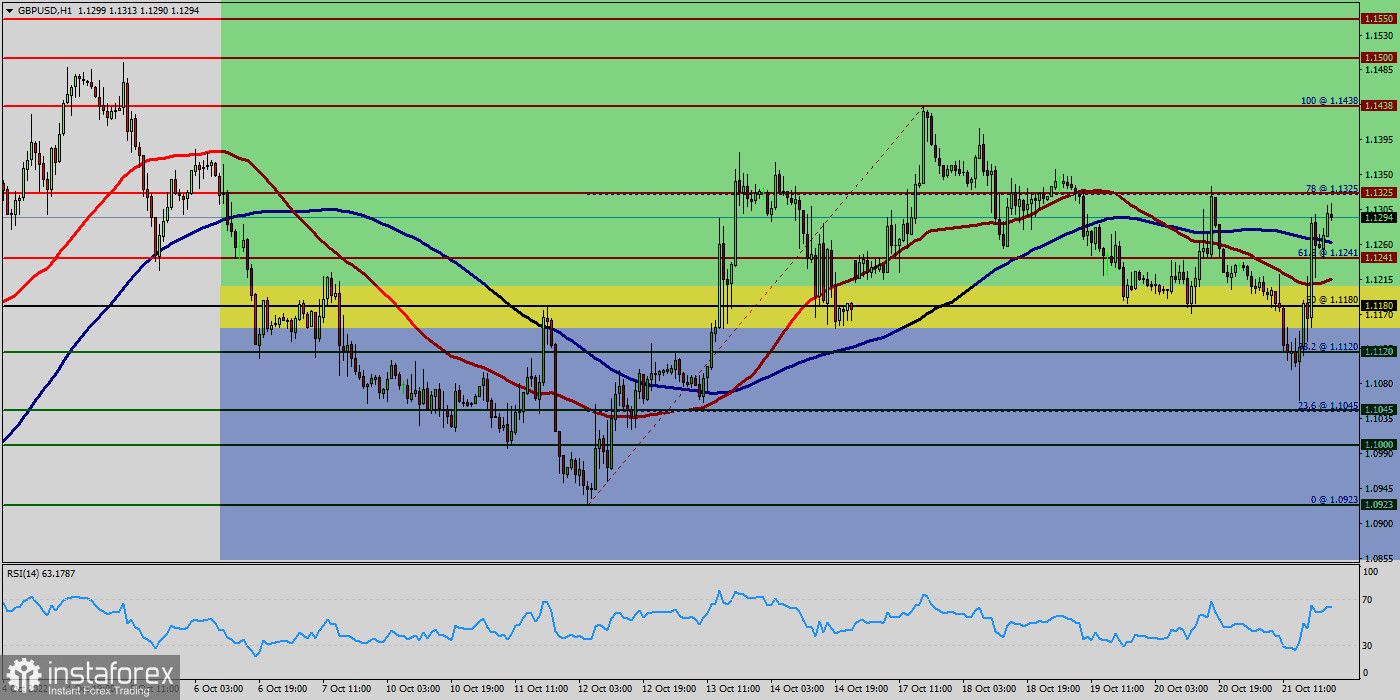
The GBP/USD pair is moving upwards from the level of 1.1208. This week, the pair rose from the level of 1.1208 (weekly support) to the top around 1.1305. Today, the first support level is seen at 1.1208 followed by 1.1141, while daily resistance is seen at 1.1368.
Technical indicators (Moving average 50 and 100, RSI (14), trend, Fibonacci retracement levels) confirm the bullish opinion of this analysis in the very short term.
However, be careful of excessive bullish movements. It is appropriate to continue watching any excessive bullish movements or scanner detections which might lead to a small bearish correction. The GBP/USD pair traded higher and closed the day in positive territory near the price of 1.1300. Today it was trading in a narrow range of 1.1208 - 1.1368, staying close to yesterday's closing price.
The GBP/USD pair faced strong support at the level of 1.1208 because resistance became support. The strong support has been already faced at the level of 1.1208 and the pair is likely to try to approach it in order to test it again. The level of 1.1208 represents a weekly pivot point for that it is acting as minor support this week. On the hourly chart, the GBP/USD pair broke through and fixed above the moving average line MA (100) H1 (1.1208).
The situation is similar on the four-hour chart. Based on the foregoing, it is probably worth sticking to the north direction in trading, and while the GBP/USD pair remains above MA 100 H1, it may be necessary to look for entry points to buy for the formation of a correction.
According to the previous events, the GBP/USD pair is still moving between the levels of 1.1276 and 1.1368; for that we expect a range of +92 pips in coming hours. This would suggest a bullish market because the RSI indicator is still in a positive area and does not show any trend-reversal signs. Furthermore, if the trend is able to break out through the first resistance level of 1.1368, we should see the pair climbing towards the double top (1.1415) to test it.
New objective at 1.1494. As long as the price remains above the support at 1.1208, you could try to take advantage of the bullish rally. The first bullish objective is located at 1.1368. The bullish momentum would be revived by a break in this resistance. Buyers would then use the next resistance located at 1.1494 as an objective.
The resistance of GBP/USD pair has broken; it turned to support around the price of 1.1180 this week. Thereby, forming a strong support at 1.1180. The direction of the GBP/USD pair into the close this week is likely to be determined by trader reaction to 1.1180 and 1.1325. The GBP/USD pair climbed above the level of 1.1180 before it started a downside correction. The GBP/USD pair set above strong support at the level of 1.1180, which coincides with the 50% Fibonacci retracement level.
This support has been rejected for three times confirming uptrend veracity. Today, the GBP/USD pair has broken resistance at the level of 1.1180 which acts as support now. Thus, the pair has already formed minor support at 1.1180. The strong support is seen at the level of 1.1120 because it represents the weekly support 1.
Hence, major support is seen at the level of 1.1120 because the trend is still showing strength above it. The level of 1.1120 coincides with the golden ratio (38.2% of Fibonacci retracement) which is acting as major support today. Another thought: the Relative Strength Index (RSI) is considered overbought because it is above 40. At the same time, the RSI is still signaling an upward trend, as the trend is still showing strong above the moving average (100), this suggests the pair will probably go up in coming hours. Technical readings in the daily chart favor a bullish continuation, as indicators maintain their firmly bullish slopes within positive levels, while the 100 MA heads firmly higher below the current level.
Equally important, the RSI and the moving average (100) are still calling for an uptrend. Therefore, the market indicates a bullish opportunity at the level of 1.0265 in the H1 chart. Also, if the trend is buoyant, then the currency pair strength will be defined as following: GBP is in an uptrend and USD is in a downtrend. Accordingly, the market will probably show the signs of a bullish trend.
This suggests the pair will probably go up in coming hours. Accordingly, the market is likely to show signs of a bullish trend. In other words, buy orders are recommended above 1.1180 level with their first target at the level of 1.1241. From this point, the pair is likely to begin an ascending movement to the point of 1.1241 and further to the level of 1.1325. The price of 1.1435 will act as a strong resistance and the double top has already set at the point of 1.1435.
On the contrary, if a breakout takes place at the support level of 1.1208, then this scenario may become invalidated. Remember to place a stop loss; it should be set below the second support of 1.1141.
Conclusion : The bullish trend is currently very strong for the GBP/USD pair - next week too.
 English
 Русский
 Bahasa Indonesia
 Bahasa Malay
 ไทย
ไทย Español
 Deutsch
 Български
 Français
 Tiếng Việt
 中文
中文 বাংলা
বাংলা हिन्दी
 Čeština
 Українська
 Română

