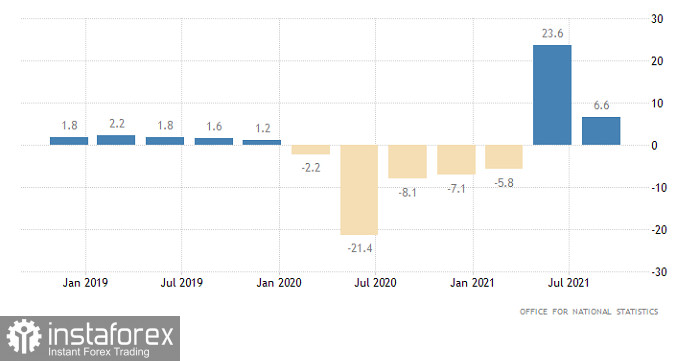
So, albeit with a slight delay, the pound was still able to successfully complete the local correction, and now a fair question arises - what next? The fact is that, apparently, the market will be at a standstill, at least until tomorrow. Although it seems like quite significant data is being published today, both for the UK and the United States. We are talking about the final GDP data for the third quarter. But the whole trick is precisely in the final nature of such data. The fact is that market participants have already been aware for a long time that the economic growth rate of the United Kingdom has slowed from 23.6% to 6.6%. After all, this is exactly what the preliminary estimates showed, which have long been embedded in the current quotes.
Change in GDP (UK):

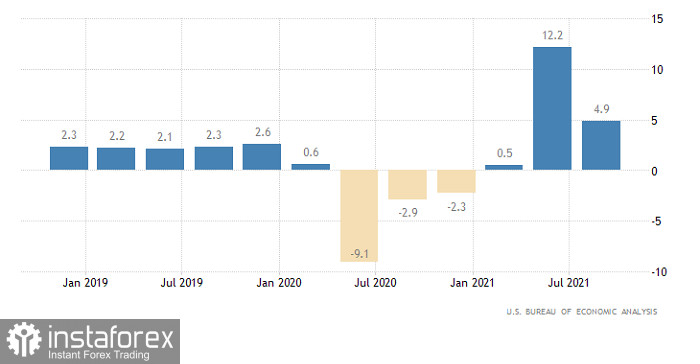
The situation is similar in the United States. The only difference is that, according to preliminary estimates, the GDP growth rate in the third quarter slowed from 12.2% to 4.9%. And since investors will not see anything new, there is no reason for any noticeable changes.
Change in GDP (United States):

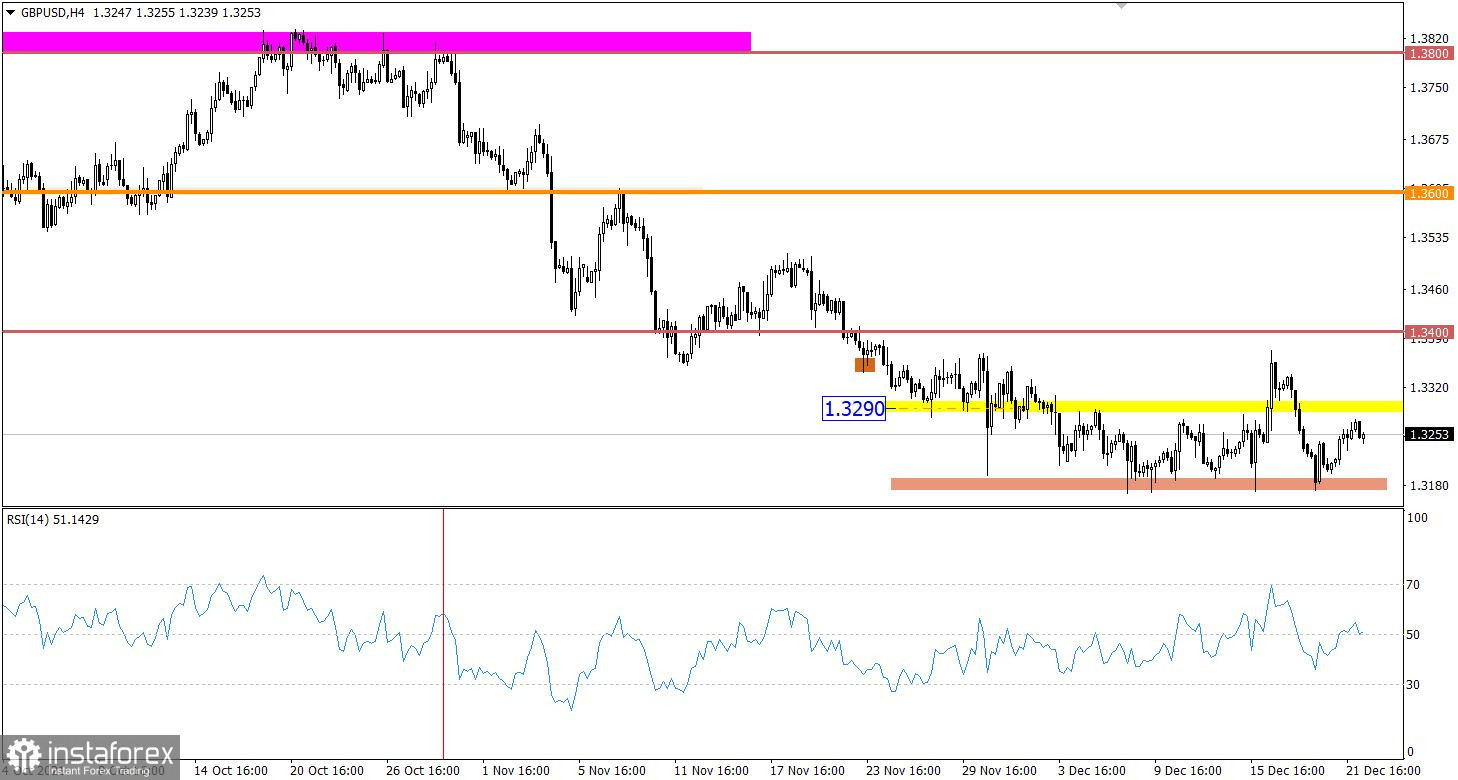
Despite the weak upward move for the GBPUSD pair, the quote, as before, remains within the previously established range of 1.3170/1.3290. This signals that the market is not yet ready for strong price changes that could lead to dramatic changes in market ticks.
The technical instrument RSI in the four-hour period moves along the 50 line, which confirms the stagnation in the market. RSI in the daytime is moving steadily in the lower area of the indicator, this is a positive signal for the development of a downward trend.
The downward trend persists on the daily chart. Its structure is stagnant in the form of a flat.
Expectations and prospects:
The movement in the horizontal channel structure is still relevant to the market, so traders are primarily focused on the tactics of price rebound from the 1.3170/1.3290 borders. Experience shows that sooner or later, the process of accumulating trade forces within the established range will end. This will cause high activity in the market, which will lead to local surges. In this case, the tactics of working on the breakdown of one or another border will be the most successful.
Complex indicator analysis has a variable signal in the short-term and intraday periods due to flat. In the medium term, technical indicators signal a sell-off due to a downward trend.

 English
 Русский
 Bahasa Indonesia
 Bahasa Malay
 ไทย
ไทย Español
 Deutsch
 Български
 Français
 Tiếng Việt
 中文
中文 বাংলা
বাংলা हिन्दी
 Čeština
 Українська
 Română

