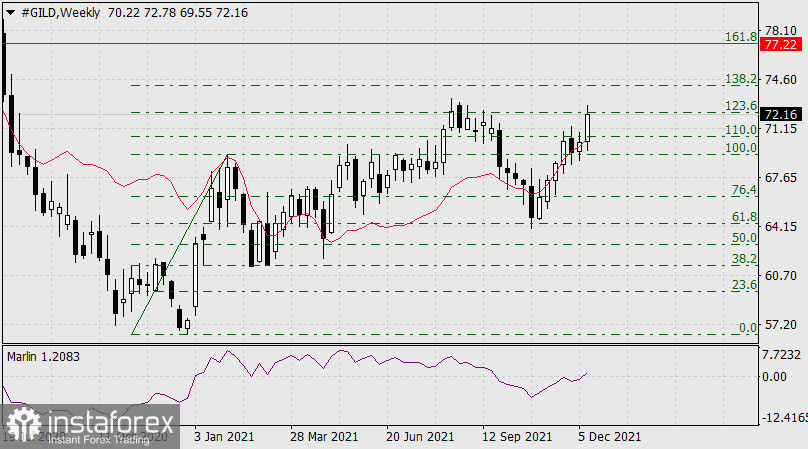
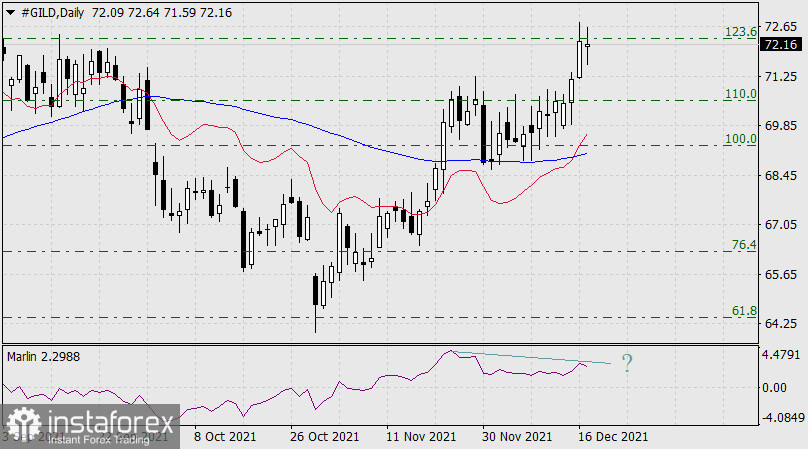
Purchase of Gilead Sciences (#GILD) shares, the US biopharmaceutical company.
On the weekly scale chart, the price consolidated above the balance indicator line. It made an attempt to break above the Fibonacci retracement level of 123.6%. The signal line of the Marlin oscillator is located in the positive zone. If the price approaches the Fibonacci level of 161.8% or 77.22, it will indicate the upward movement.

On the daily chart, the last five candlesticks were rising quickly. The last candlestick slowed down a bit at the Fibonacci level of 123.6%. However, the current dynamic facilitates further growth. There is one negative factor. The Marlin oscillator may form a reversal divergence. Even if it happens, there is a chance divergence may not occur. As a result, the Marlin indicator may continue to grow.

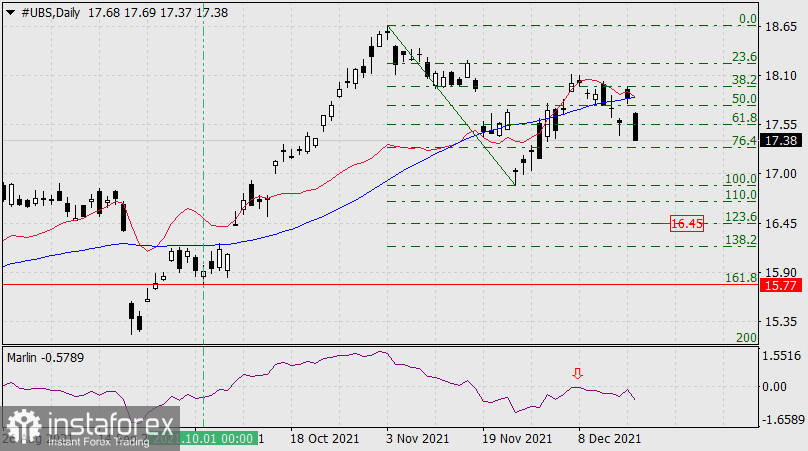
Short positions on UBS Group AG (#UBS) shares, the Swiss financial holding.

On the daily scale chart, the price held below the indicator trend line - the Kruzenshtern line. After a reversal from the positive zone (from the zero line) on December 8, the Marlin oscillator keeps dropping, entering the bearish trend. Technical indicators show a downward movement. The ultimate target level is the Fibonacci retracement level of 161.8% or 15.77. The nearest target level is situated at 16.45, the Fibonacci level of 123.6%.
 English
 Русский
 Bahasa Indonesia
 Bahasa Malay
 ไทย
ไทย Español
 Deutsch
 Български
 Français
 Tiếng Việt
 中文
中文 বাংলা
বাংলা हिन्दी
 Čeština
 Українська
 Română

