Following the results of the FOMC meeting, almost all parameters of the monetary policy remained unchanged. The regulator only trimmed the quantitative easing program by another $30 billion. Market participants were prepared for such an outcome. They were mainly interested in the terms and number of the key interest rate hikes next year. However, the Fed avoided this topic, voicing only certain expectations. The regulator tried to predict how it might alter monetary policy if macroeconomic data met its requirements. So, the central bank supposes that it may raise the key rate three times over the next year. The quantitative easing program may be terminated in March or April. The rhetoric is definitely hawkish but it lacks any specifics. Moreover, the Fed usually provides plans for two years, whereas this time it has announced some initiatives for 2022. Nevertheless, there is no doubt that the monetary policy tightening will be more aggressive than expected.
For this reason, analysts were confused why the pound sterling rose when it was expected to drop. To start with, the Fed did not give any precise information as if the Fed was not responsible for the parameters of monetary policy. Additionally, today, the ECB and the BoE will also hold a meeting. Interestingly enough, just before the announcement of the results of the FOMC meeting, some media agencies reported that the ECM may announce monetary policy tightening. However, earlier, ECB policymakers carefully avoided this topic and did not provide any hints that it could occur. This looks like market manipulation. Nevertheless, not to lag behind the US Fed, the ECB will have to raise the key interest rate at least four times. Yet, it is quite unlikely. Besides, taking into account the debt burden of all EU states, the odds are slim. The fact is that a sharp change in the monetary policy may trigger some negative consequences. Thus, the US dollar is likely to a develop long-term rally, though with a slight delay.
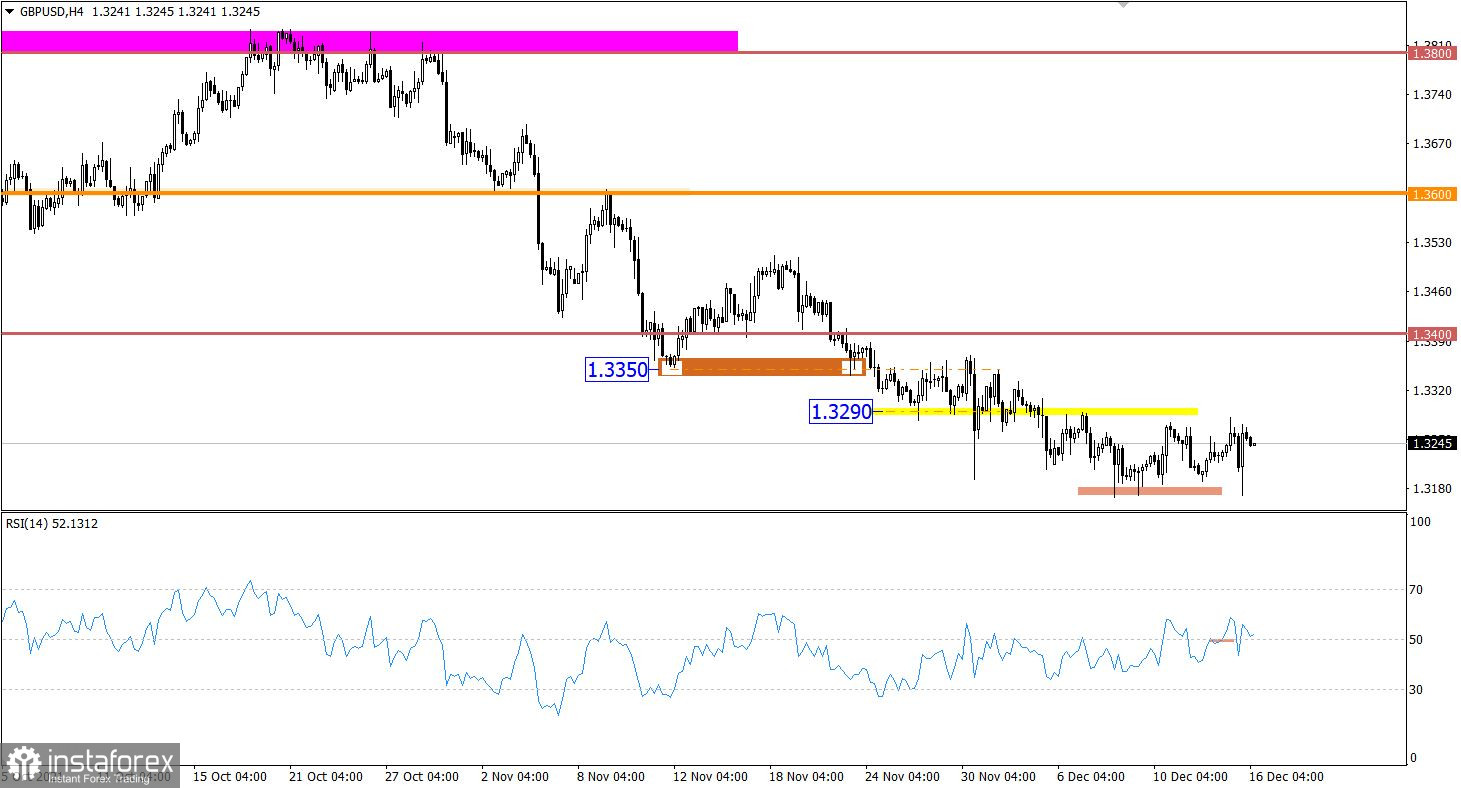
Despite market speculation, the GBP/USD pair is trading within the range of 1.3200/1.3290, consistently breaking out the indicated levels. The longer the quotes remain in a narrow range, the stronger their movement will be.
The RSI indicator is moving steadily along the 50 line on the 4H chart. It confirms the formation of a flat pattern.
On the daily chart, there is a slight stagnation in the structure of the downtrend. This indicates a high chance of prolongation of a given cycle.
Outlook:
The sideways channel in the 1.3200/1.3290 range is likely to be completed soon. If this scenario comes true, it is recommended to stick to the Breakout Strategy.
If the price consolidates above 1.3300 on the 4H chart, it will be appropriate to open long positions.
One should consider short positions if the price holds below 1.3165 on the 4H chart.
The complex indicator analysis gives a sell signal on short-term and intraday charts due to the price rebound from the upper limit. Technical indicators signal short positions in the medium term on the back of a steady downward movement.

 English
 Русский
 Bahasa Indonesia
 Bahasa Malay
 ไทย
ไทย Español
 Deutsch
 Български
 Français
 Tiếng Việt
 中文
中文 বাংলা
বাংলা हिन्दी
 Čeština
 Українська
 Română

