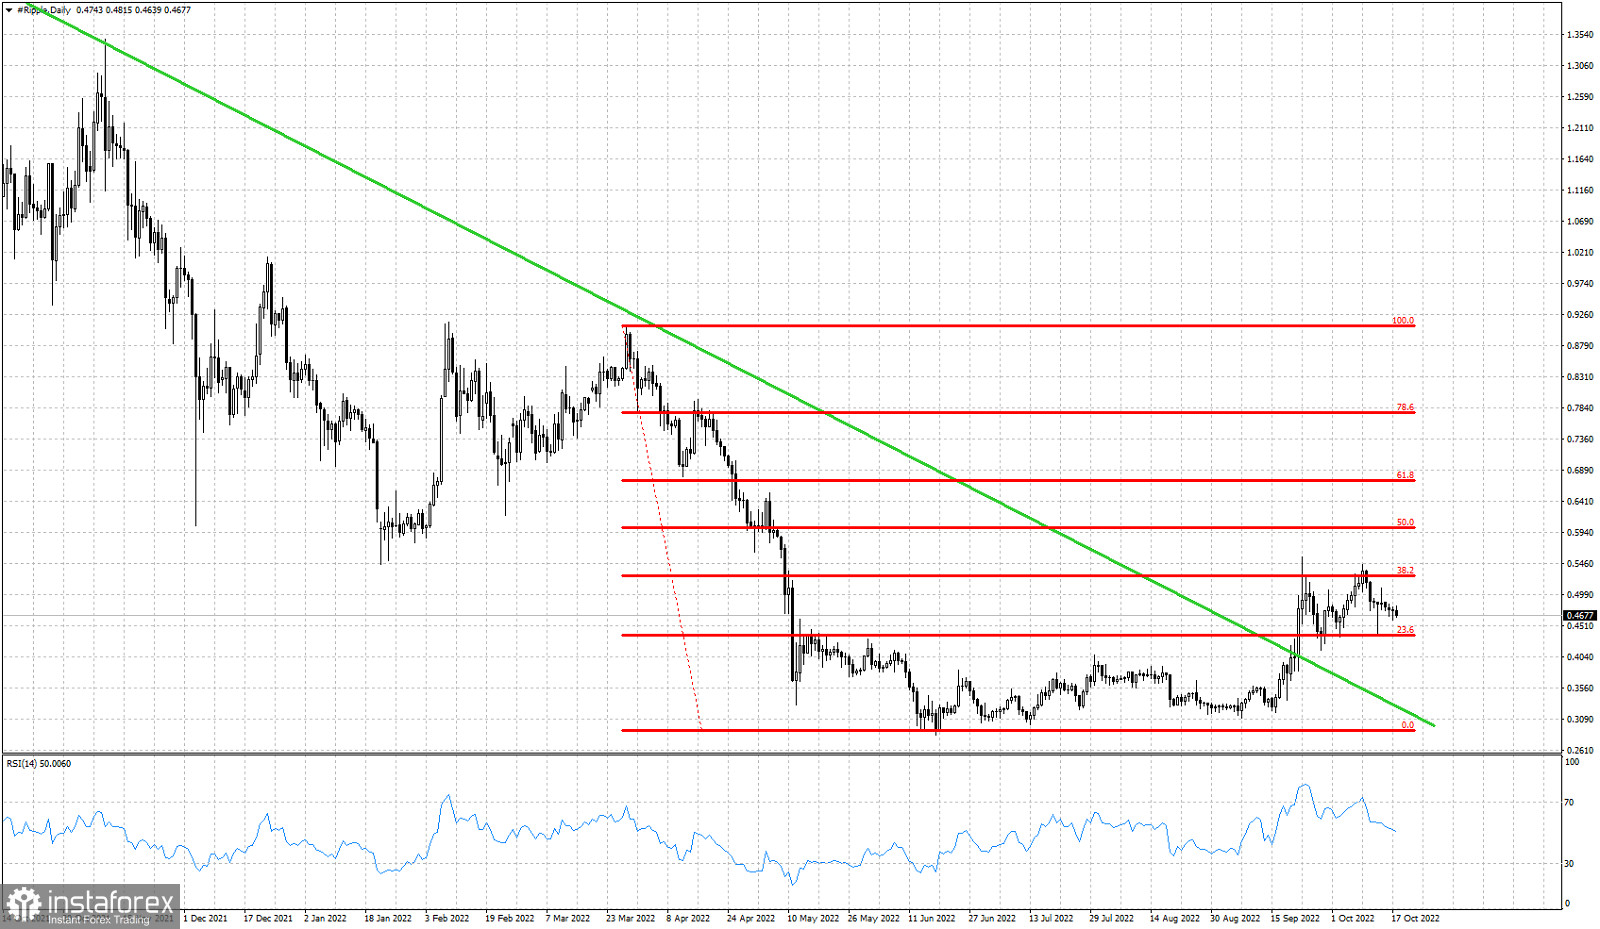
Red lines- Fibonacci retracements
Green line- resistance trend line
XRPUSD is trading around $0.46. Price recently got rejected at the 38% Fibonacci retracement for the second time and fell as low as $0.43. In a previous analysis we noted that after the rejection price was vulnerable to a move towards $0.40. Price has broken above an important trend line resistance but has stopped the advance at the 38% Fibonacci resistance level. As long as we trade below this level, XRPUSD will be vulnerable to more downside. Recent low at $0.43 is now key support as a break below this level would be a bearish sign that would imply more selling pressures should be expected. A break above $0.53-$0.5350 would be a bullish signal. If resistance is broken we will expect XRPUSD to reach at least $0.67 and next at $0.77. Until then we remain cautious.
 English
 Русский
 Bahasa Indonesia
 Bahasa Malay
 ไทย
ไทย Español
 Deutsch
 Български
 Français
 Tiếng Việt
 中文
中文 বাংলা
বাংলা हिन्दी
 Čeština
 Українська
 Română

