For the second week in a row, bitcoin has been going through a consolidation stage which is characterized by a price movement within a specific range. The accumulation of BTC trade volumes by large market players and stabilizing futures market indicate that BTC is in the final stage of correction. This suggests that the asset may have one strong decline ahead after which will be followed by a new upward movement.
BTC/USD fundamental picture
First, let's look at the facts that confirm the end of the correction. Let's start with the futures market which has become a major source of trouble for the cryptocurrency. With the launch of the BTC futures ETF in November, the market was overheated by December. This means that a lot of traders have opened long positions with high leverage in order to maximize profit from the future Bitcoin rally. However, instead of a rally, there was a powerful collapse that cleared the crypto market from speculative positions. As of December 15, the futures market has stabilized, that is, the open interest of investors fell below the appropriate mark of $330k. In addition, according to Glassnode experts, large market players resumed purchases of bitcoin. These two key facts indicate that the market has stabilized and is preparing for a bullish rally.
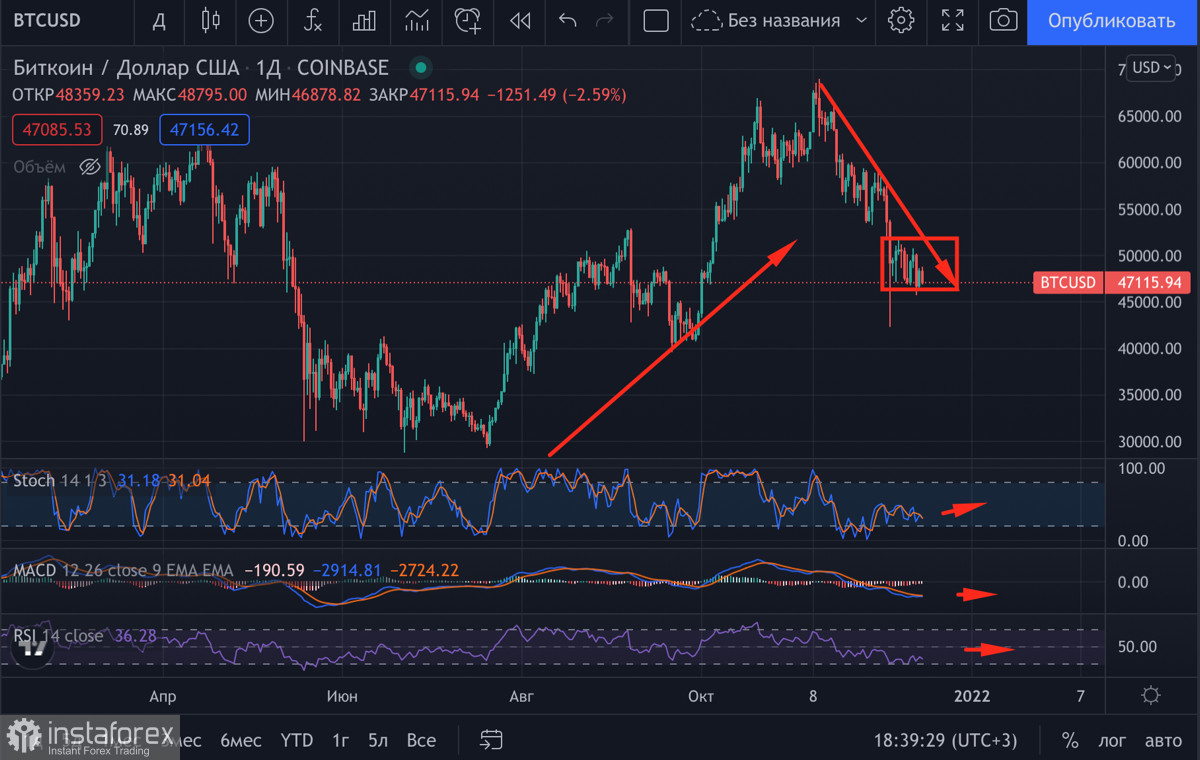
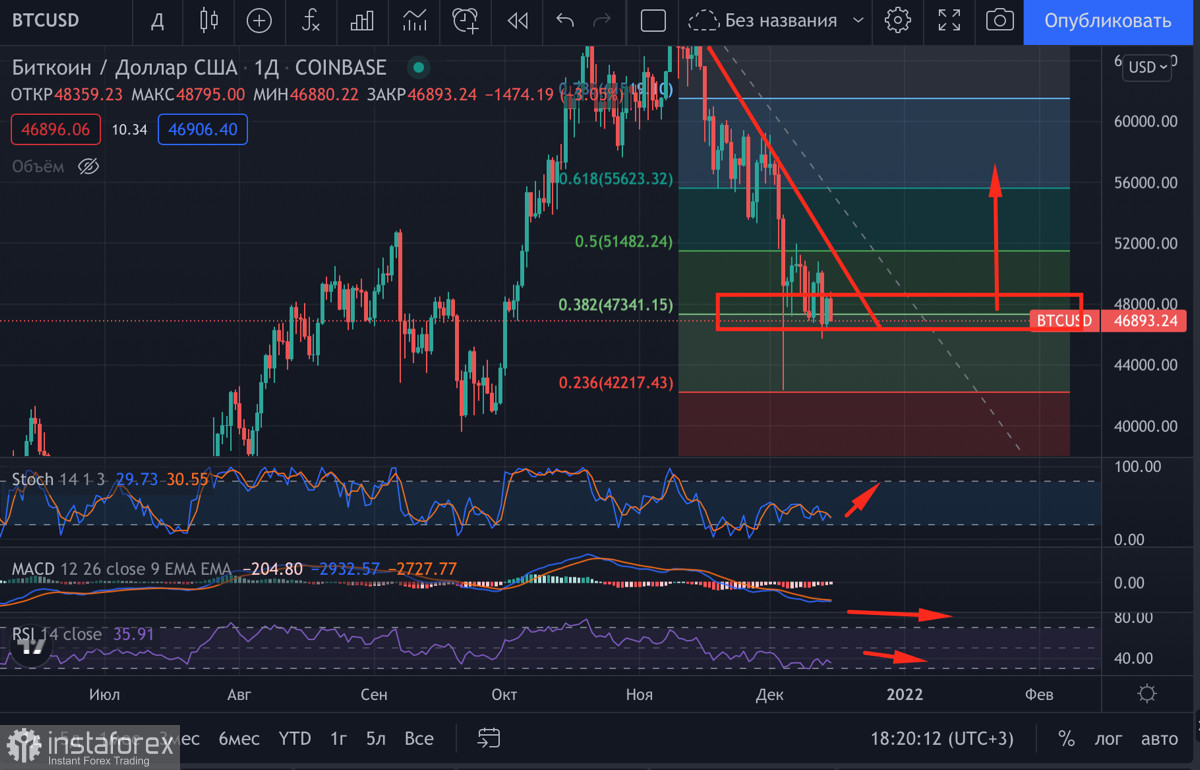
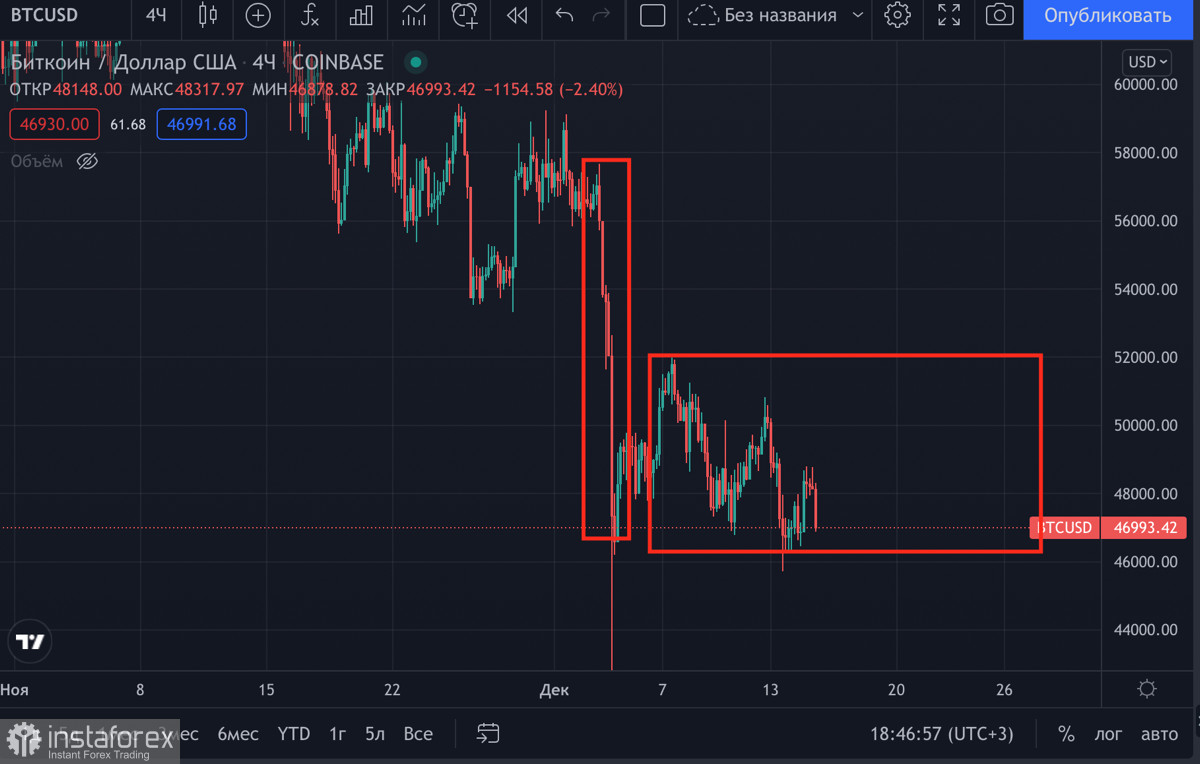
Based on this background, let's analyze the technical picture of bitcoin. The price is still moving in a local downtrend according to the daily BTC chart. After a downward momentum movement, the price is trading in a sideways channel that often follows strong market moves. The current charts do not indicate any particular direction for now. This means a decline in bullish activity and a decrease in sell positions. Therefore, I see two possible scenarios for the price movement.

Bullish scenario
Bitcoin is currently heading for a local low near the area of $46k-$48k. Over the past week, the coin has never dropped below this range which signals the formation of a powerful support zone. This theory is supported by a strong long-term support level of $46.6k which crosses the 200-day moving average. Closing the day above this zone is an important bullish signal. If bears fail to break through this level in the next two days, we can say that the local low has completed its formation.

Bearish scenario
The second scenario is more pessimistic as bitcoin may go even lower to the level of $42k. The main argument supporting this scenario is the price rebound from this zone on December 4. The shadow turned out to be 50% larger than the body of the candlestick which indicates a high probability of a repeated decline in this area. In addition, over the past three days, the price has touched the lower support level twice. According to the rule, the more often the price falls towards the target, the more likely it is to break through it. Therefore, I assume a possible breakout of the $46k level and a further decline.

Downward potential of the price
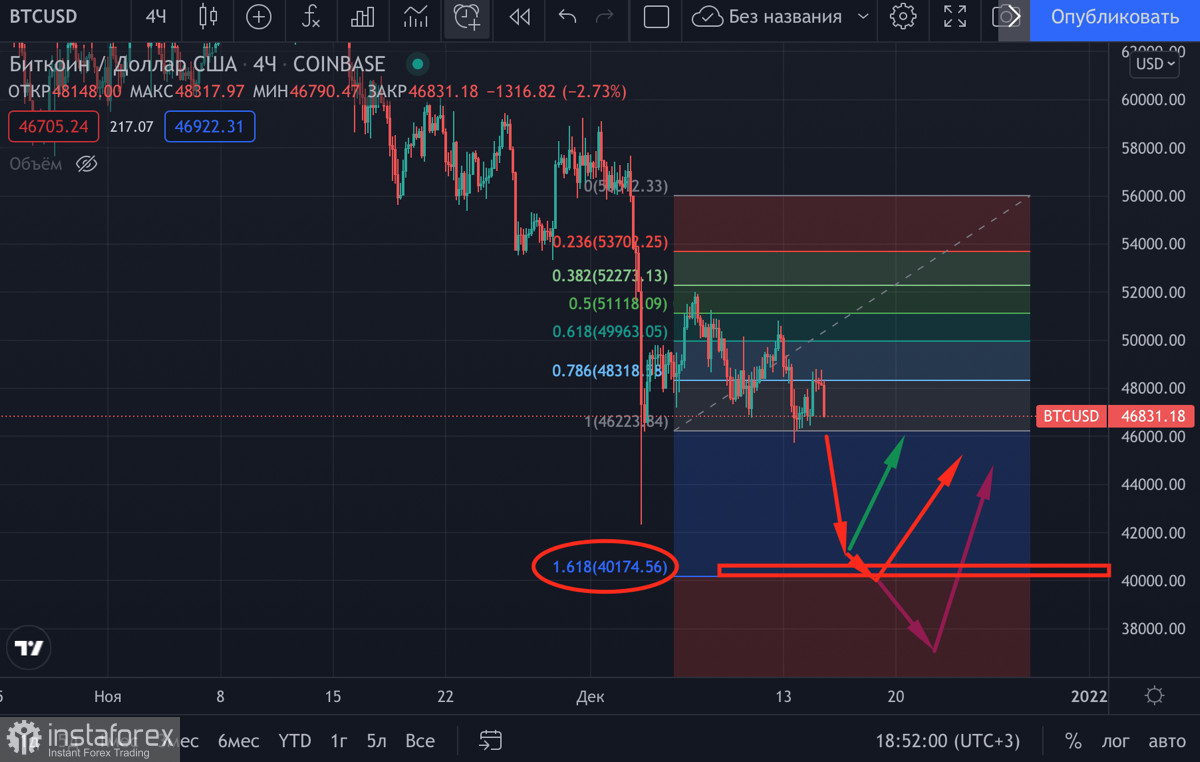
To determine the scope of a potential decline, you need to plot Fibonacci levels from the support zone to the line where the downward momentum started on the 4-hour chart. According to the formed levels, the final point of the corrective section may be the level of $40,200. We should keep in mind that when moving downwards, the price can either reach the specified zone or break through it with a subsequent rebound.

Notably, it does not matter which scenario will eventually come true as the outcome will be the same. Regardless of where bitcoin forms a local low, a further upward movement will lead to new highs. Bears have reached their maximum level, and buyers are slowly regaining strength to resume the uptrend. The outcome may be clear by the end of this week, and by the end of 2021, BTC may be halfway to reaching a new all-time high.
 English
 Русский
 Bahasa Indonesia
 Bahasa Malay
 ไทย
ไทย Español
 Deutsch
 Български
 Français
 Tiếng Việt
 中文
中文 বাংলা
বাংলা हिन्दी
 Čeština
 Українська
 Română

