EUR/USD
Analysis:
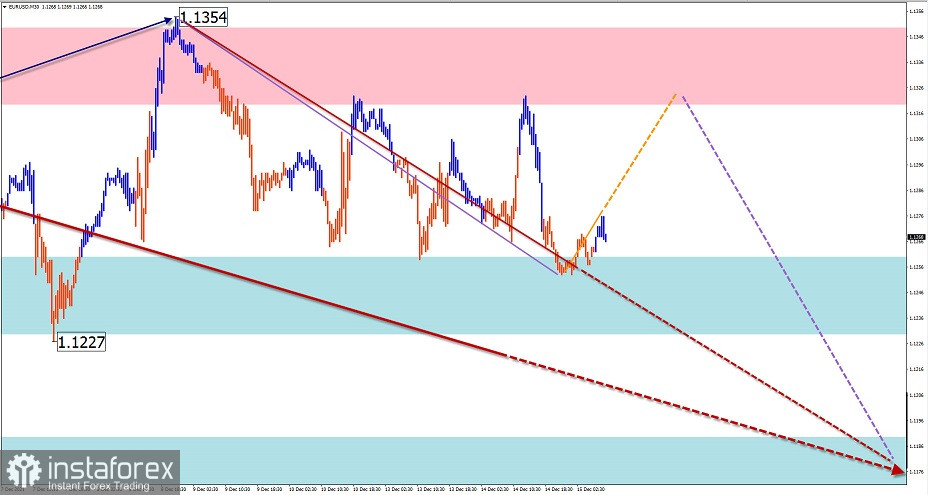
The euro continues its move downwards, according to the descending wave algorithm from January 6. The price has been corrected horizontally since late November. The current quotes are within the boundaries of the potential reversal zone of the older daily chart. The last incomplete short-term wave traces back to November 30.
Outlook:
In the first half of the day, a flat movement is expected in the range between the opposing zones today. In the US session, there is a good chance of a return to a bearish course. There is a high probability of a breakout of the nearest support today.
Potential reversal zones
Resistance:
- 1.1320/1.1350
Support:
- 1.1260/1.1230
- 1.1190/1.1160
Recommendations:
Buying in the euro market today is quite risky and could become unprofitable. It is recommended to refrain from trading the pair until there are clear sell signals.

USD/JPY
Analysis:
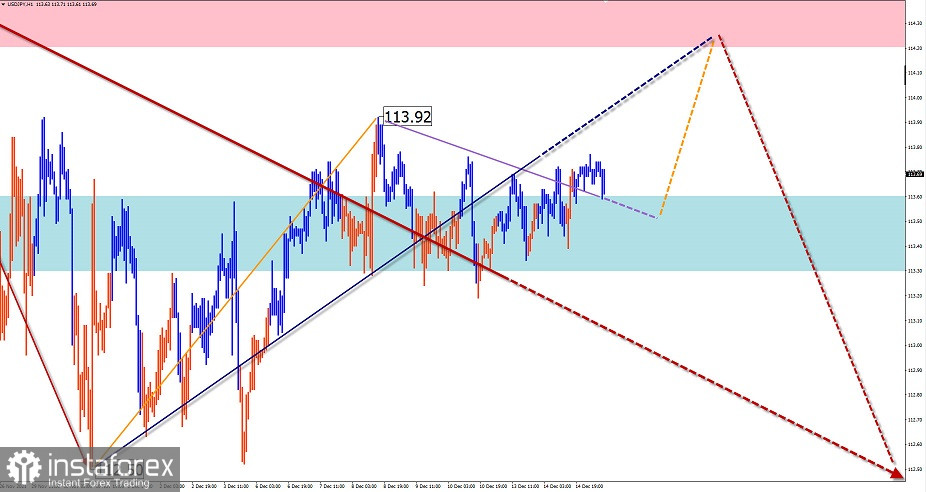
As a result of the price rally since the beginning of this year, the Japanese Yen has reached the boundaries of a large scale reversal zone in the main pair. A correction in the form of a stretched plane has formed within the limits of the reversal zone during the last two months. The upward movement from November 30 has no reversal potential at the moment of analysis.
Outlook:
A continuation of the general upward price movement is expected in the next 24 hours. At the European session, there is a high probability of sideways flat along the support zone. An increase in volatility and a price rise is more likely at the end of the day or tomorrow.
Potential reversal zones
Resistance:
- 114.20/114.50
Support:
- 113.60/113.30
Recommendations:
When planning trades in the yen market, it is worth taking into account the limited potential for upcoming price gains. There is no condition to sell today.

GBP/JPY
Analysis:
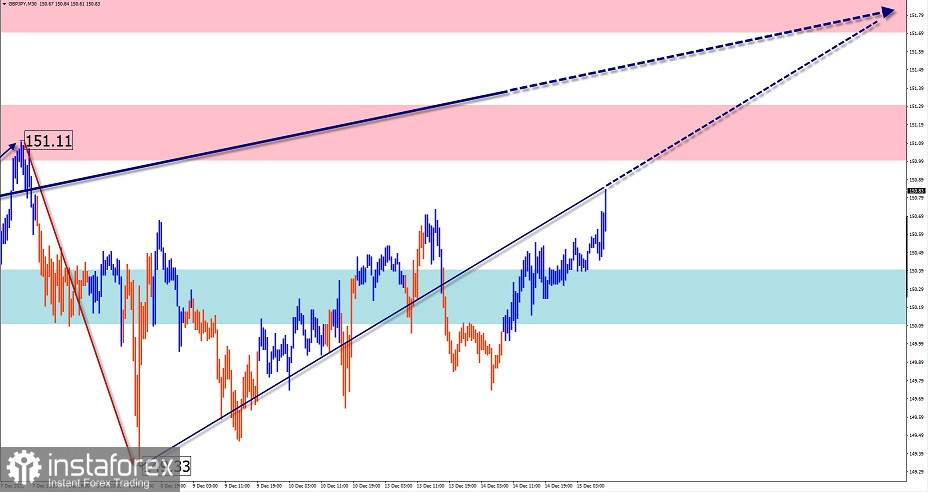
As part of the dominant ascending wave in the last two months, the Pound/Yen cross price is correcting to the south of the price chart. By now the price has reached the upper boundary of the preliminary target zone. But there are no signals of an imminent reversal on the chart. The rising wave that started on December 3 has no reversal potential yet.
Outlook:
A flat price movement between the nearest zones is expected in the next trading sessions. Short-term decline to the support area is not excluded. In the second half of the day, the probability of changing the vector and increasing the rate, with a breakthrough of the nearest resistance limits is increasing.
Potential reversal zones
Resistance:
- 151.70/152.00
- 151.00/151.30
Support:
- 150.40/150.10
Recommendations:
Today it is optimal to refrain from trading the pair until there are clear buying signals around the calculated support.

GOLD
Analysis:
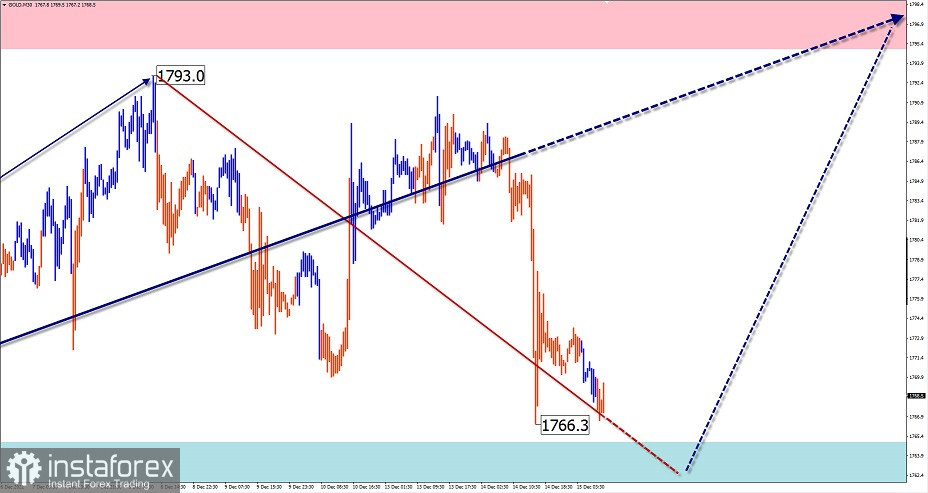
A bullish wave pattern has been developing on the gold chart within the dominant upward plane since late February for the past two weeks. It has reversal potential. With a high probability, it will launch a new round of upward movement.
Outlook:
After an attempted pressure on the support zone in the coming session, a reversal is expected and a subsequent price rise, all the way to the resistance zone.
Potential reversal zones
Resistance:
- 1795.0/1800.0
Support:
- 1765.0/1760.0
Recommendations:
There are no selling conditions in the gold market today. It is recommended to monitor the emerging signals of your trading systems to buy the instrument.

Explanation: In simplified wave analysis (SVA), waves consist of 3 parts (A-B-C). The last unfinished wave is analysed. The solid arrow background shows the structure formed. The dotted arrow shows the expected movements.
Attention: The wave algorithm does not take into account the duration of the instrument movements over time!
 English
 Русский
 Bahasa Indonesia
 Bahasa Malay
 ไทย
ไทย Español
 Deutsch
 Български
 Français
 Tiếng Việt
 中文
中文 বাংলা
বাংলা हिन्दी
 Čeština
 Українська
 Română

