Analysis of Tuesday trades:
M30 chart

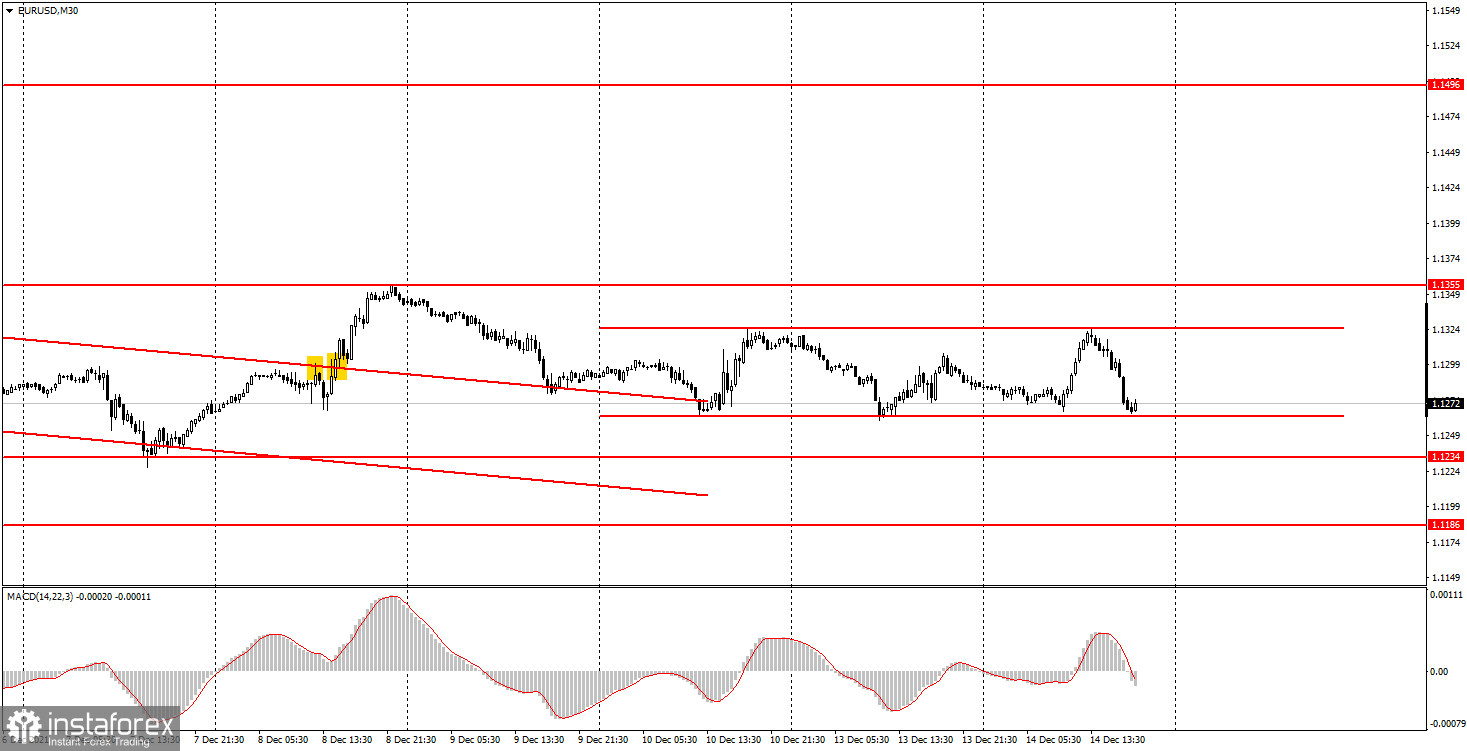
On Tuesday, the EUR/USD pair broke through the descending trend line. Earlier, the quote also broke through the ascending trend line. Thus, both lines were removed from the chart and a sideways channel was formed. The pair has been trading within the sideways channel for three days. The quote is expected to leave the channel on Wednesday when the Federal Reserve announces a monetary policy decision. So, the market is likely to be extremely volatile on Wednesday. However, there is no guarantee that a trend will begin. As for yesterday's macroeconomic calendar, it was empty both in the United States and the eurozone. Volatility was at a very low level, and the pair broke through the trend lines easily. Similar signals were formed both on the M30 and lower time frames.
M5 chart

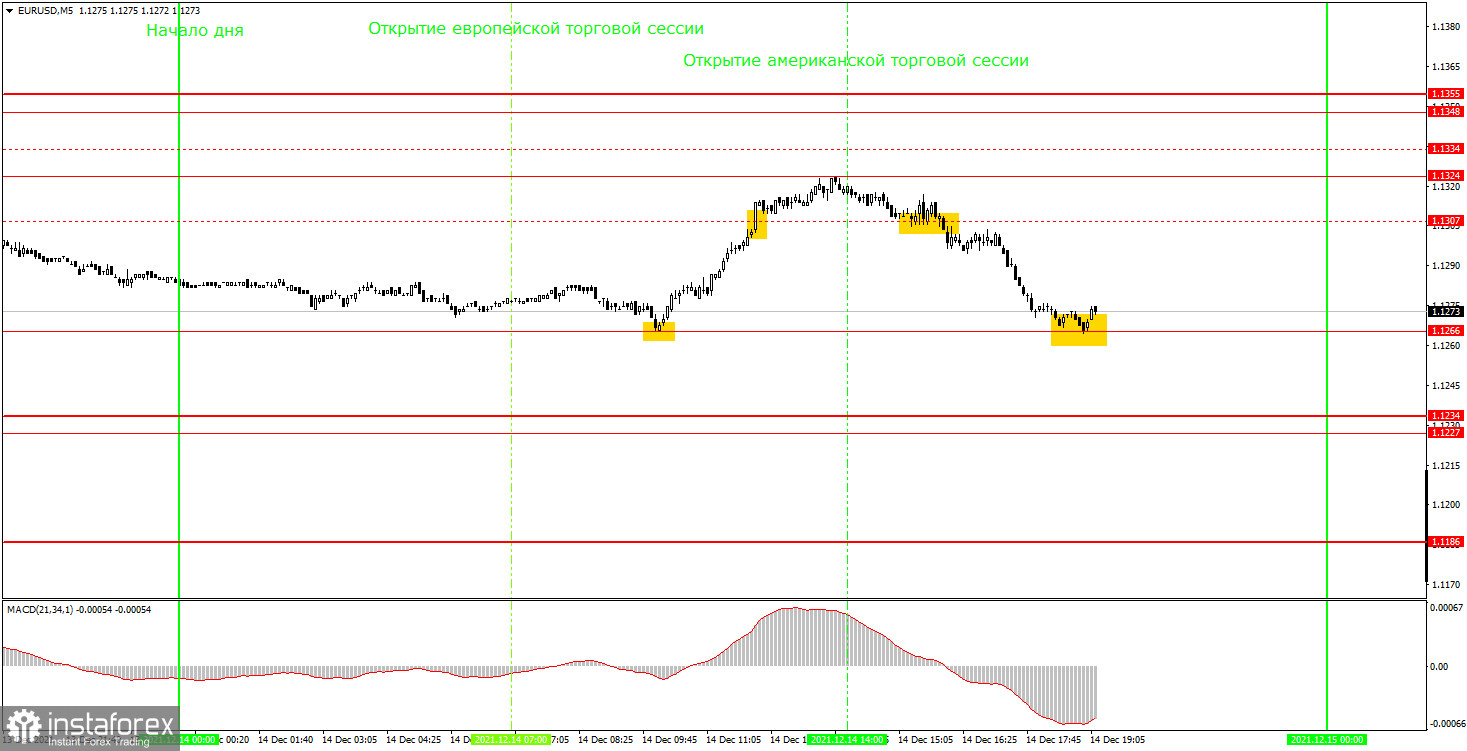
On the M5 chart, the pair moved in a trend. This trend movement was part of a flat on the H1 chart. Anyway, Tuesday was a nice day to enter the market as several signals were produced. For instance, the first buy signal was formed after a rebound from 1.1266. So, novice traders were supposed to open long positions there. Then, the quote broke through the level of 1.1307, and again, it was the right moment to go long. Consequently, consolidation below 1.307 generated a sell signal. There, beginner traders were supposed to close long positions and enter short ones. The profit from long positions totaled 24 pips. Short positions were also profitable (50 pips) because the price returned to 1.1266 and rebounded from it by the end of the North American session.
How to trade EUR/USD on Wednesday:
On the M30 chart, the pair is moving in a sideways channel. If the price leaves the channel today, a signal will be produced. However, novice traders should trade cautiously because the pair may fluctuate sharply due to the FOMC meeting. So, in case a new trend starts during the course of the day, it may well change by the end of it. The key levels for December 15 on the M5 chart are 1.1227-1.1234, 1.1266, 1.1324, and 1.1348-1.1355. A take-profit order is to be set at a distance of 30-40 pips. A stop-loss order is to be placed at the breakeven point when the quote passes 15 pips in the required direction. On the M5 chart, the target is seen at the nearest level if it is located not too close or too far. Otherwise, you should take it from there or work according to Take Profit. The eurozone's macroeconomic calendar is empty on Wednesday. The United States will present a retail sales report for November and the Federal Reserve will announce its policy decision, which is likely to affect the euro/dollar pair. In other words, the market is expected to be extremely volatile today.
Major rules of trading:
1) The strength of a signal is calculated by the time it took a signal to form (bounce or break through a level). The less time it takes, the stronger is the signal.
2) If two or more trades are opened near a certain level based on false signals (that did not trigger a take-profit order or a test of the nearest target level), then all subsequent signals from this level should be ignored.
3) Being flat, any pair might form a lot of false signals or non at all. In any case, when seeing the first signs of a flat, trading should be stopped.
4) Trades are opened within the time period between the opening of the European session and the middle of the North American session when all trades should be closed manually.
5) On the M30 chart, trading should be carried out based on signals from the MACD indicator only if there is good volatility or a trend confirmed by a trend line or a channel.
6) If two levels are located close to one another (from 5 to 15 pips), they should be considered as the area of support or resistance.
Indicators on charts:
Support and resistance are target levels when buying or selling a pair. A take-profit order could be set near them.
Red lines are channels or trend lines that display the current trend and show in what direction it is preferable to trade now.
MACD (14, 22, 3) is a histogram and a signal line, the crossing of which produces a signal to enter the market. It should be used in combination with trend patterns (channels, trend lines).
Important speeches and reports (always contained in the calendar) can greatly influence the movement of a currency pair. Therefore, at the time of publication, market players should trade very cautiously or exit the market to avoid a reversal.
Beginners should remember that not every trade will be profitable. An effective trading strategy and money management are the keys to success in long-term trading.
 English
 Русский
 Bahasa Indonesia
 Bahasa Malay
 ไทย
ไทย Español
 Deutsch
 Български
 Français
 Tiếng Việt
 中文
中文 বাংলা
বাংলা हिन्दी
 Čeština
 Українська
 Română

