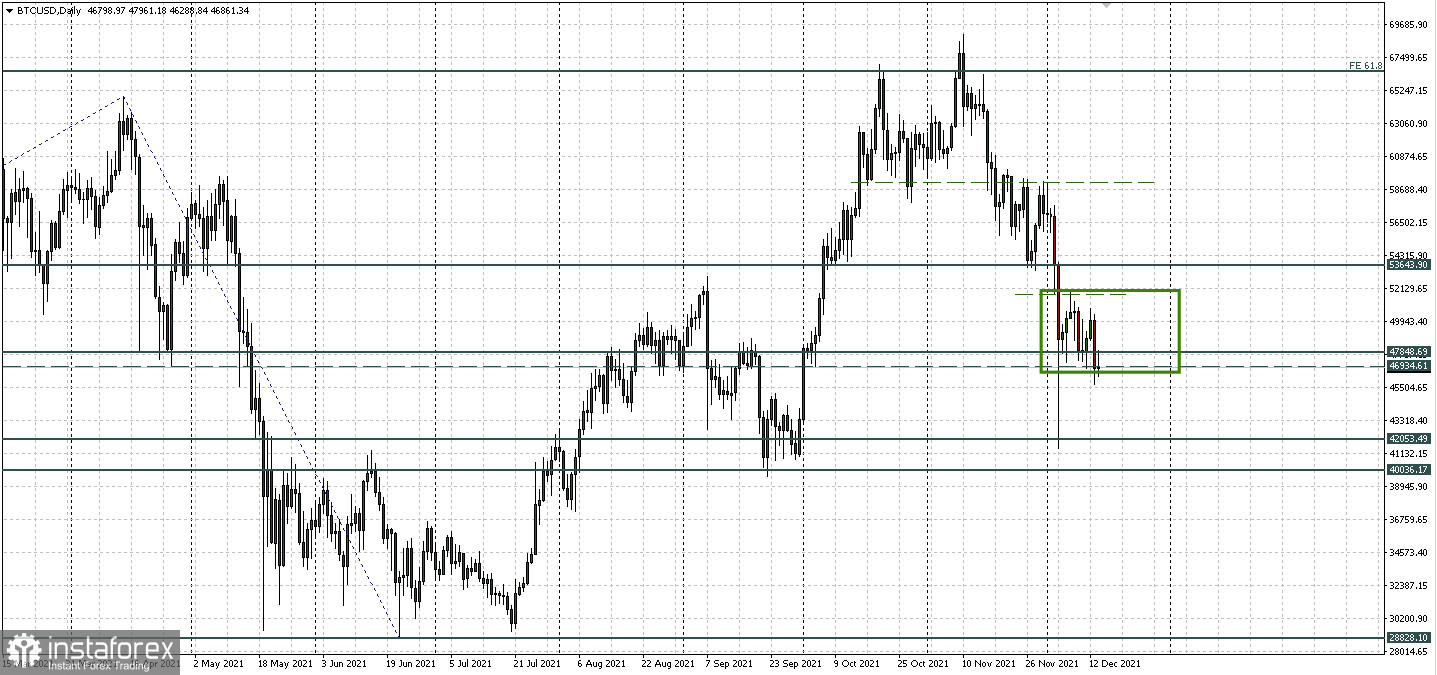
Bitcoin is still very shakily balancing in the range between the support zone of 46,934.61 - 47,848.69 and the resistance of 51,697.58. On Monday, the lower limit stood, today it is also standing, which gives a chance for recovery.
But the scenario is very close in which the price may collapse into the region of $40,000 - $42,000 per coin. The main question that is now frozen literally in the air: are we already in a bear market?
Mass liquidations in the futures market
The capitalization of the global cryptocurrency market after the fall of bitcoin over the last day has decreased by 6.44% and is hovering slightly above $2.12 trillion.
During the previous collapse on December 3, there was a surge in the liquidation of bitcoin positions. Short positions in BTC futures worth $235 million and long positions in the amount of $846 million were forcibly closed. Then, in two days, the BTC spot price collapsed from $51,000 to $42,000. At the same time, on December 4, there was a collapse of open interest in bitcoin futures from $23 billion to $17 billion.
Fear of players in the spot market
Nevertheless, the last drop in the price to almost $45,000 on Tuesday did not entail similar liquidations. Notably, the spot market seemed more affected as lower trading volumes and higher market fear make investors skeptical about what to do next.
Now we see that even the sideways position in which bitcoin could move, as usual during periods of uncertainty, is a big question. Market participants try not to make sudden movements and, most likely, are waiting for new drivers.
A fall in December is not a fall in May. Don't panic!
Experts suggest comparing bitcoin's current price trajectory to the May drop in prices from a network point of view. The key difference between now and May is that strong hands are now buying from weak ones, while strong hands turned into weak ones in May.
In addition, if you look at the BTC HODL wave for +1 year, then approximately 54.6% of all coins in circulation did not move in +1 year. The indicator is currently down 8.8% from a local high of 63.4% set in September 2020. However, there are signs of a rise in the indicator that could indicate a BTC supercycle if the upward trend continues.
The Fed will help solve the dilemma
The results of the Fed meeting will be announced on Wednesday evening. Earlier, we mentioned a report by Bloomberg Intelligence Senior Commodity Strategist Mike McGlone that the Fed's decisions could affect Bitcoin and Ether.
But tomorrow, the rhetoric and tone of statements by the American Central Bank can determine the position of bitcoin relative to the support zone 46,934.61 - 47,848.69 and set the direction, perhaps even before the end of the year.

 English
 Русский
 Bahasa Indonesia
 Bahasa Malay
 ไทย
ไทย Español
 Deutsch
 Български
 Français
 Tiếng Việt
 中文
中文 বাংলা
বাংলা हिन्दी
 Čeština
 Українська
 Română

