GBP/USD 5M

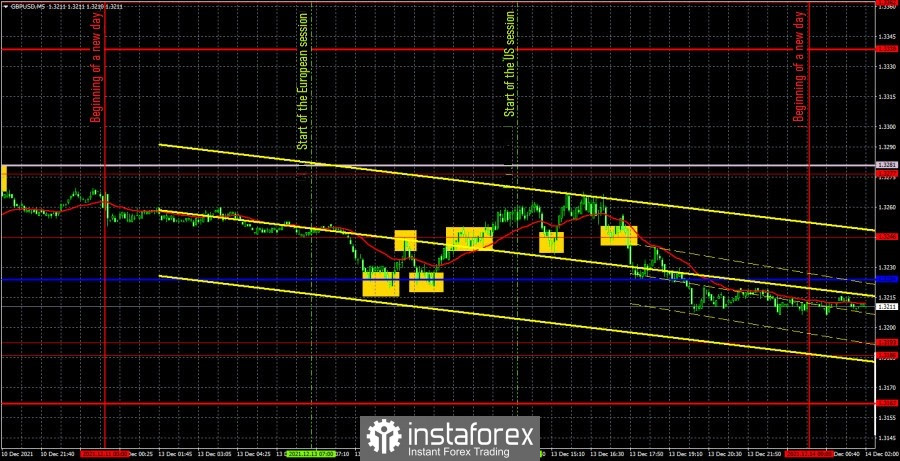
The GBP/USD pair was also not trading very actively on Monday. The volatility of the day was about 50 points, which is very little for the pound. Thus, trading this pair yesterday was also quite difficult. In general, the pound initially declined, then grew, then fell again. However, as already mentioned, all these movements were as weak as possible. Not a single important macroeconomic event took place during the day, either in the UK or in the US. In Britain, a speech by the Governor of the Bank of England Andrew Bailey was planned, but in any case it took place in the evening, when traders had to leave the market and close all transactions. Thus, we just have to parse all the trading signals of the day. The situation with the pound is very similar to the situation with the euro. All signals were formed near the Kijun-sen line and the extremum level of 1.3246, between which there was a distance of 22 points. Formally, it was possible to work out these signals. First, the pair bounced off the Kijun-sen line - a buy signal, then from the 1.3246 level - a sell signal, then again from Kijun-sen - another buy signal. It was possible to earn 5 points of profit on the first two signals. The price settled above the level of 1.3246 on the third, but could not get to the next target level of 1.3277. Therefore, the long position should have been closed when the price settled below the level of 1.3246, already in the middle of the US trading session. However, since the price went up more than 20 points in total, Stop Loss triggered at breakeven, which saved traders from receiving losses on this deal. The last sell signal in the form of surpassing the 1.3246 level could be worked out, or it could have been missed, since it was formed quite late. In any case, it could have been another 10-13 points in profit, which is not much. As a result, the day ended with the least profit, as well as for the euro.
GBP/USD 1H

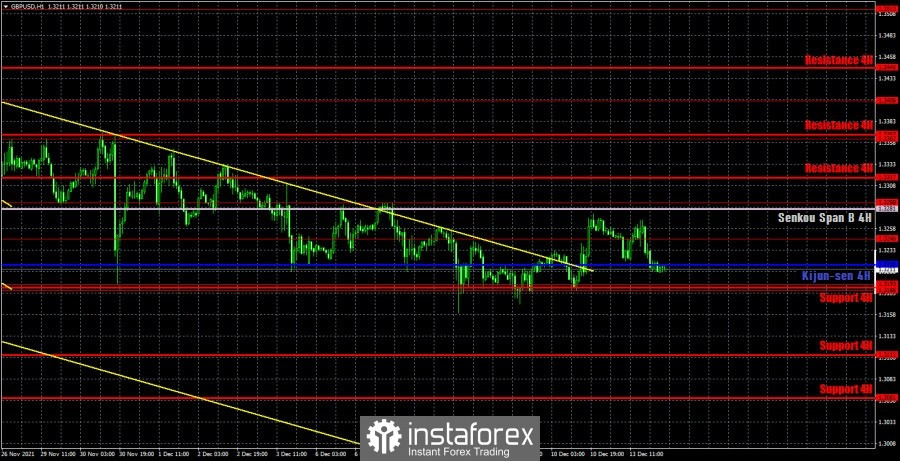
On the hourly timeframe, the pound/dollar pair, after leaving the downward trend channel, is trying by all means to start an upward trend. So far, however, little has come of it. The bulls here are just as weak as in the euro/dollar pair. So far, the price has not even managed to overcome the Senkou Span B line, and the movement itself in recent weeks is very weakly reminiscent of the trend. Moreover, the markets are unlikely to be interested in actively trading before the meetings of the Federal Reserve and the Bank of England. We distinguish the following important levels on December 14: 1.3186 - 1.3193, 1.3246, 1.3288, 1.3362, 1.3406. There are no levels below, since the price has not been so low for over a year. Senkou Span B (1.3281) and Kijun-sen (1.3216) lines can also be signal sources. Signals can be "rebounds" and "breakthroughs" of these levels and lines. It is recommended to set the Stop Loss level at breakeven when the price passes 20 points in the right direction. The Ichimoku indicator lines can move during the day, which should be taken into account when looking for trading signals. On Tuesday, the UK is due to publish reports on unemployment, claims for unemployment benefits and average earnings. In theory, this data could affect the pound and its exchange rate against the dollar. In practice, we believe that there will be very little or no response. Markets will also be focused on two central bank meetings, the results of which will be released later this week.
We recommend you to familiarize yourself:
Overview of the EUR/USD pair. December 14. What if the Fed raises rates on Wednesday?
Overview of the GBP/USD pair. December 14. Here's how: the European Union may start another legal procedure against the UK over the "fish" issue.
Forecast and trading signals for EUR/USD for December 14. Detailed analysis of the movement of the pair and trade deals.
COT report

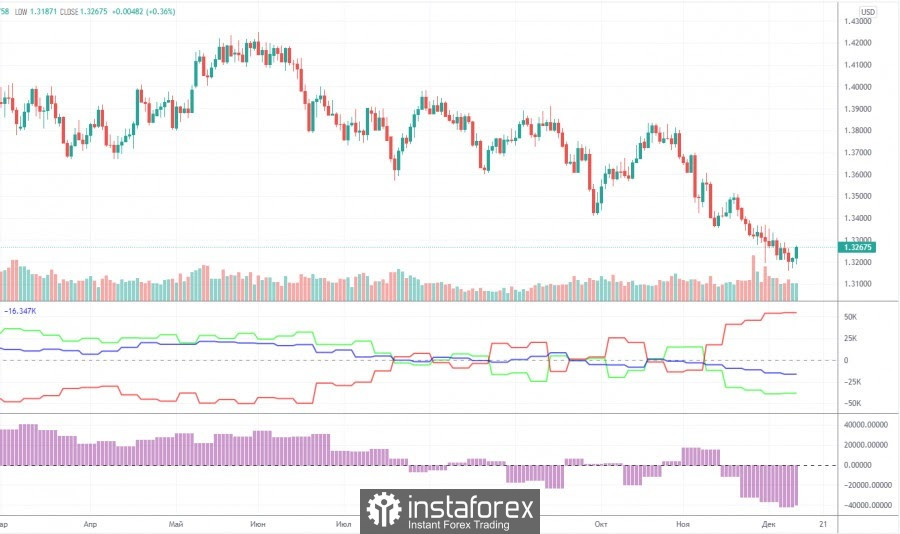
The mood of professional traders became a little less bearish during the last reporting week (November 30 – December 6). Professional traders closed 3,600 sell contracts (shorts) and 2,100 buy contracts (longs) during the week. Thus, the net position for the "non-commercial" group of traders increased by 1,500 contracts. This is a very small change even for the British pound. In general, the mood of non-commercial traders continues to be bearish, and quite strong. We draw your attention to how low the green line of the first indicator is located in the chart above, which reflects the net position of the non-commercial group. Thus, unlike the euro, the pound's decline in recent weeks looks just logical: major players sell off the currency, and it falls. A further decline in the British currency is also now quite likely, but at the same time we draw your attention to the fact that the green and red lines of the first indicator have moved quite far from each other. This may indicate that the downward trend is drying up. Thus, we get a situation in which the euro currency is not moving down quite logically, and the pound may complete its movement in the near future. Thus, for both major pairs, we recommend waiting for the downward trend to end, but do not start buying until specific buy signals are formed.
Explanations for the chart:
Support and Resistance Levels are the levels that serve as targets when buying or selling the pair. You can place Take Profit near these levels.
Kijun-sen and Senkou Span B lines are lines of the Ichimoku indicator transferred to the hourly timeframe from the 4-hour one.
Support and resistance areas are areas from which the price has repeatedly rebounded off.
Yellow lines are trend lines, trend channels and any other technical patterns.
Indicator 1 on the COT charts is the size of the net position of each category of traders.
Indicator 2 on the COT charts is the size of the net position for the non-commercial group.
 English
 Русский
 Bahasa Indonesia
 Bahasa Malay
 ไทย
ไทย Español
 Deutsch
 Български
 Français
 Tiếng Việt
 中文
中文 বাংলা
বাংলা हिन्दी
 Čeština
 Українська
 Română

