 English
  Русский
 Bahasa Indonesia
 Bahasa Malay
 ไทย
ไทย Español
 Deutsch
 Български
 Français
 Tiếng Việt
 中文
中文 বাংলা
বাংলা हिन्दी
 Čeština
 Українська
 Română

Wave layout
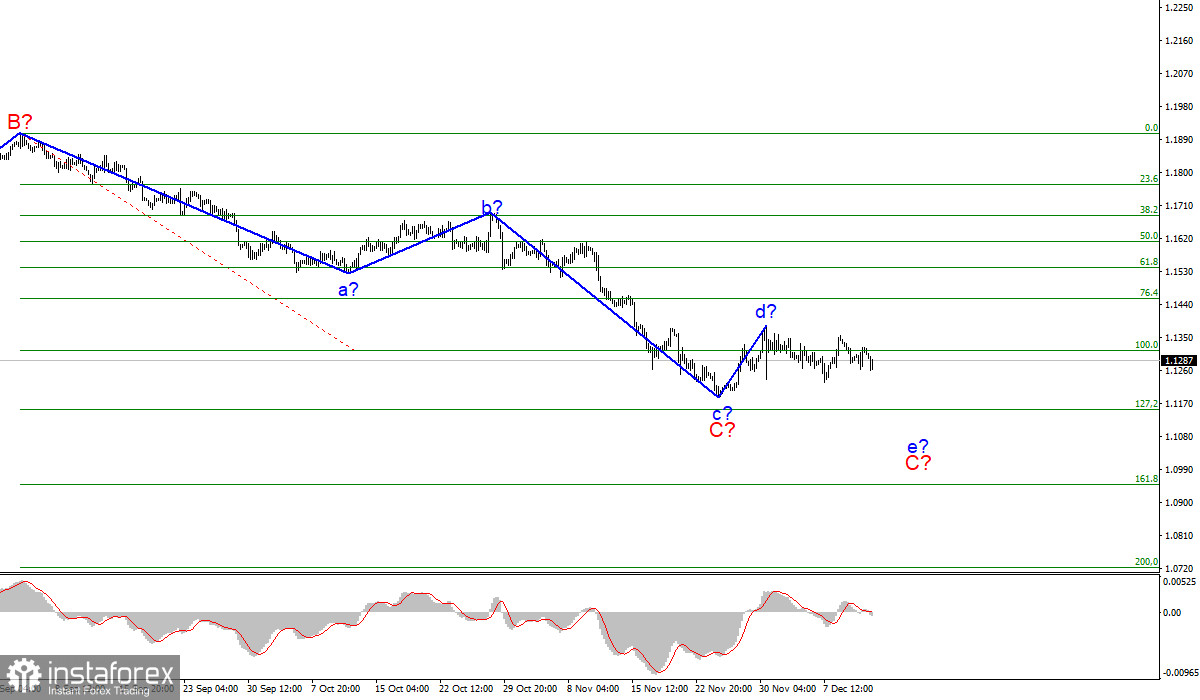
The wave layout for EUR/USD remains complete on the 4-hour chart and does not suppose any changes. Currently, expected wave C is in progress that is likely to evolve into a 5-wave structure. Apparently, upward wave d inside wave C is over. If the ongoing wave structure is true, inner wave e inside wave C is being built now. A breakout of 100.0% Fibonacci level has been successful. It indicates that the market is ready for more selling. Therefore, the currency pair is set to trade lower this week with the target at 1.1152 that is 127.2% Fibonacci level. This is the level where the whole downward trend section might get complete.
Besides, please be aware that wave C is taking a correctional mode. The whole downward trend section that came into being in January 2021 may evolve into a five-wave structure like A-B-C-D-E. This scenario can be discussed at least wave C comes to an end.
Investors want to play safe before ECB and Fed's policy meetings
The information background for EUR/USD was boring on Monday. The economic calendar was empty. No news was released today that could make any impact on market sentiment. Hence, it is no surprise that the currency pair made small fluctuations of 30 pips. On the contrary, this is nice amid the empty economic calendar. Curiously, a decline of EUR/USD is tricky to explain from the point of the information background. The trading instrument shed 40-50 pips today. Perhaps, there is no logical explanation of this move.
The market is in suspense ahead of the blockbuster week. Three major central banks are holding policy meetings. The Federal Reserve is due to unveil its policy decisions on Wednesday, the ECB and the Bank of England are having meetings on Thursday. On Tuesday, the economic calendar is empty. Nevertheless, traders are free to act pricing in their expectations of policy updates from the US Fed and the ECB. The fact that expected wave d could have already been complete means that demand for the US dollar may be growing again. The current wave layout is unlikely to be destroyed. The strength of the US dollar comes from market expectations that the US Fed could resort to more aggressive tightening and withdraw monetary stimulus at a faster pace. Recently, there have been rumors that the regulator could reduce its bond purchases by extra $20 or even $30 billion per month. Market participants have found evidence in favor of this scenario because an annual inflation rate surged to 6.8% in November.
Conclusions
Based on this wave analysis, I reckon that downward wave C might be completed. However, the inner wave layout of this wave makes me believe that another downward wave e is in the cards. All in all, I recommend selling EUR/USD with the target at near 1.1152 at each signal of the MACD indicator.
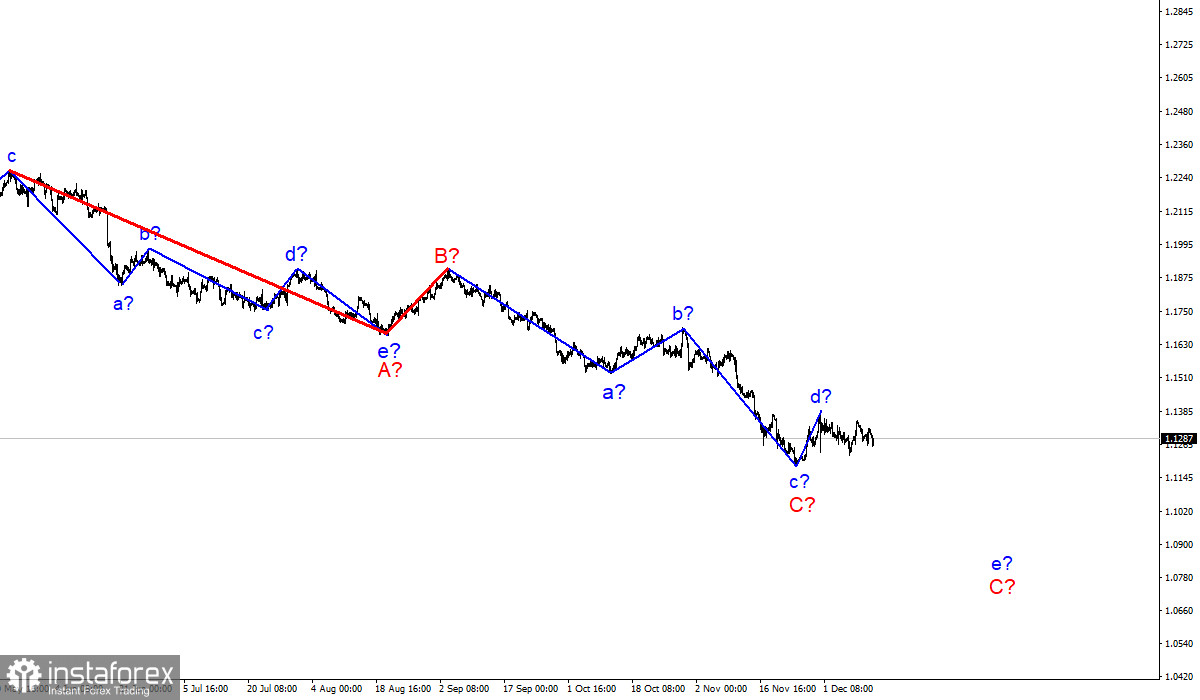
Chart of senior timeframe
The wave layout of the senior timeframe looks rather convincing. The currency pair is still trading lower. The downward trend section that began on May 25 is now split into a 3-wave correctional pattern A-B-C. I guess the downward trend might go on for at least 5 weeks until wave C is not fully packed. It should look like a 5-wave structure in this case.