GBP/USD
Analysis:
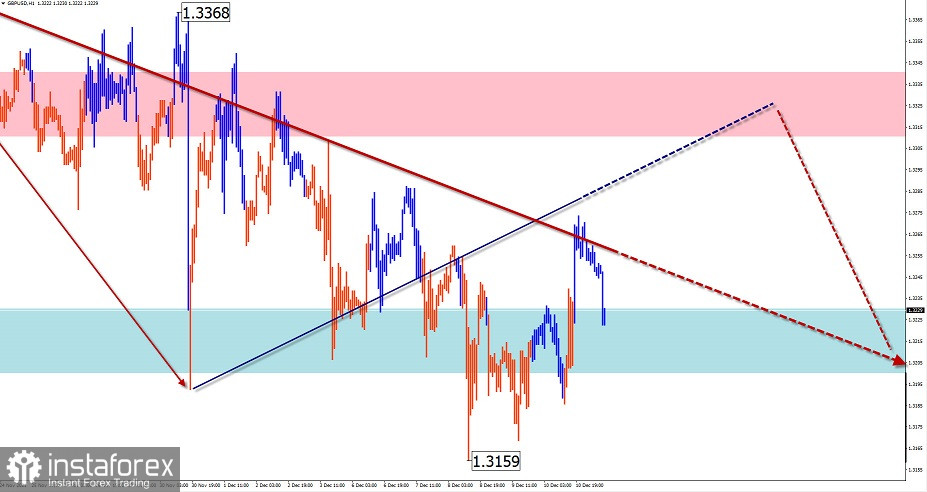
Within the dominant bearish wave of the English pound sterling main pair, the formation of its final part (C) continues. Since November 30, a counter-corrective movement in the form of a shifting plane has been developing on the chart. Its final segment has not been formed.
Outlook:
A general upward vector of price movement is expected today. On the European session, the flat condition is not excluded, with the reduction to the support area. The price growth phase is more likely at the end of the day or tomorrow.
Potential reversal zones
Resistance:
- 1.3310/1.3340
Support:
- 1.3230/1.3200
Recommendations:
Trading in the English pound market today is most appropriate within individual sessions. Until the occurrence of clear signals of a reversal in the resistance area sales are not recommended. Trading lot for buying is recommended to reduce.

AUD/USD
Analysis:
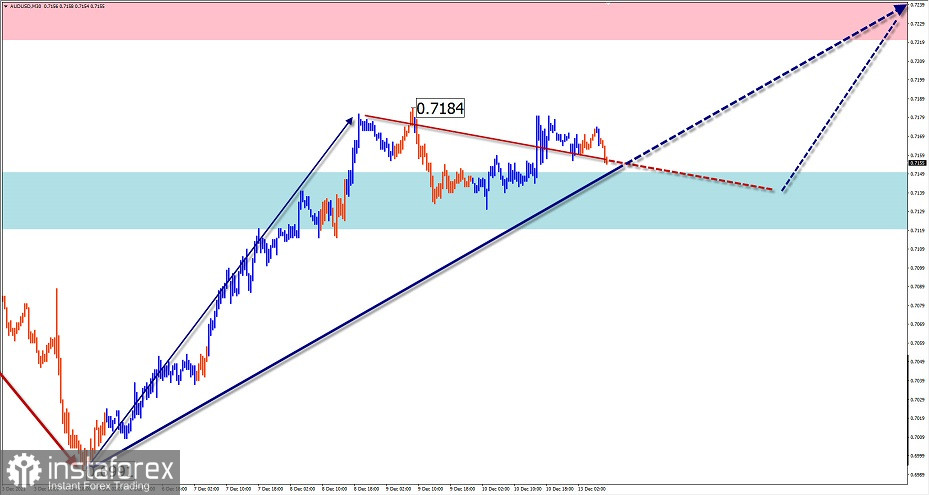
The general direction of the Australian dollar's short-term trend since February is set by a downward wave algorithm. Since December 3 an uptrend with reversal potential is forming. This could be the beginning of a new wave of counter direction.
Outlook:
A continuation of the general bullish movement vector is expected in the coming day. In the first half of the day, a sideways flat along the support zone is more possible. Then we can expect a rise in the rate. A break beyond the calculated resistance within the day is unlikely.
Potential reversal zones
Resistance:
- 0.7220/0.7250
Support:
- 0.7150/0.7120
Recommendations:
Trading in the Australian dollar market today can only be profitable as part of scalping, within individual sessions. There are no conditions for selling.

USD/CHF
Analysis:
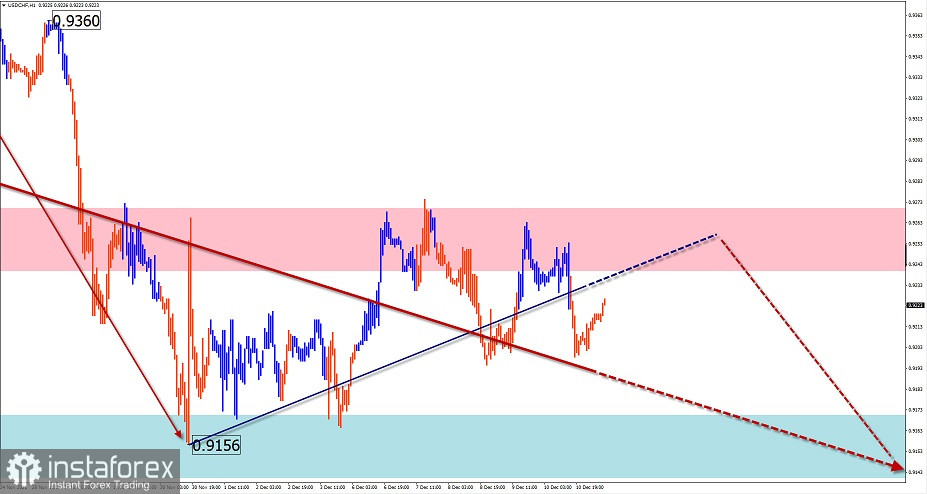
The current sideways movement of the Swiss franc quotations in the main pair over the last six months fits into a downward plane algorithm. Since November 24, the final part (C) has started. An intermediate pullback has been forming in the last 2 weeks within its framework.
Outlook:
The general sideways movement is expected to continue today. In the first half of the day, some rate increase can be expected, not further than the calculated resistance. By the end of the day, against the background of increased volatility, a change of vector and subsequent downward price movement is possible.
Potential reversal zones
Resistance:
- 0.9240/0.9270
Support:
- 0.9170/0.9140
Recommendations:
There are no conditions for buying the franc today. Sell signals are to be monitored around calculated resistance.

USD/CAD
Analysis:
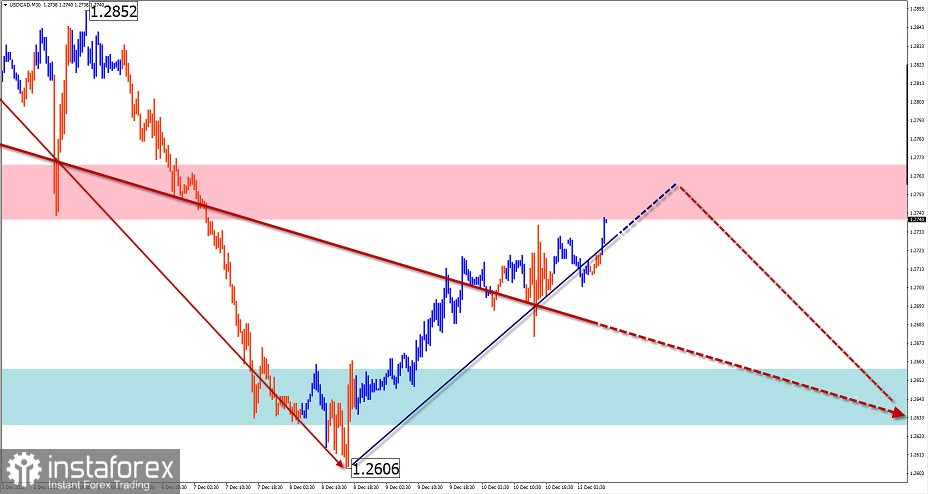
The Canadian dollar has been steadily strengthening against the US currency since last March. The price has been predominantly in a sideways drift for the last six months. Since July a descending plane is developing on the chart, in which the final part is forming. In the last few days, the price has been bouncing upwards.
Outlook:
In the next 24 hours, the most expected scenario will be a sideways movement in the price corridor between the opposing zones. After a possible pressure on the resistance zone, we can expect a change of vector and a downward price move.
Potential reversal zones
Resistance:
- 1.2740/1.2770
Support:
- 1.2660/1.2630
Recommendations:
There are no conditions for buying in the Canadian dollar market today. It is recommended to monitor signals for sale in the area of calculated resistance. Taking into account the limited impending decline, it is better to reduce the trading lot.

Explanation: In simplified wave analysis (SVA), waves consist of 3 parts (A-B-C). The last unfinished wave is analysed. The solid arrow background shows the structure formed. The dotted arrow shows the expected movements.
Attention: The wave algorithm does not take into account the duration of the instrument movements over time!
 English
 Русский
 Bahasa Indonesia
 Bahasa Malay
 ไทย
ไทย Español
 Deutsch
 Български
 Français
 Tiếng Việt
 中文
中文 বাংলা
বাংলা हिन्दी
 Čeština
 Українська
 Română

